
How To Measure ROI Of B2B Employee Personal Branding Programs
- How-To Guides

Employee personal brands extend your company's reach, but without measurement, it is hard to justify resources.
This guide helps B2B marketing and HR teams build a clear, defensible approach to reporting business outcomes from employee social activity on LinkedIn and other professional channels.
Purpose: Turn activity into measurable outcomes.
Scope: Awareness, engagement, lead signals, and talent impact.
Outcome: A replicable measurement plan and dashboard checklist.
Start with clear goals and mapped outcomes
The first step is to link employee activity to business outcomes. Use three goal buckets:
- Awareness: Reach, impressions, profile views.
- Engagement and trust: Comments, shares, follower growth, sentiment.
- Demand and talent signals: leads, meeting requests, job inquiries.
For each bucket, define one primary KPI and two supporting metrics. That keeps reporting focused and aligns to stakeholders.
Attribution models that work for employee advocacy
Employee posts are often organic and multi-touch. Use pragmatic attribution:
Direct attribution for actions that clearly originate from an employee post, like a tracked link click that results in a demo booking.
Assisted attribution for leads where employee content increased engagement during the buying process, measured via lead surveys or lead scoring uplift.
Correlation tracking when direct links are missing: track timing of spikes in inbound inquiries after coordinated employee campaigns.
Combine these with UTM parameters, dedicated landing pages, and short-form tracking to connect employee activity to conversions.
Practical tip
Always append UTM tags to campaign links and add a hidden field or source on forms that captures "employee_post" values. This makes direct attribution clean and repeatable.
Suggested KPI set for B2B teams
Below is a compact KPI set that balances visibility and business outcomes.
Reach: Total impressions and profile views from employee posts.
Engagement rate: Likes, comments, shares divided by impressions.
Lead signals: Demo requests, content downloads, or contact form submissions tied to employee campaigns.
Talent signals: Inbound recruiter messages and job application volume resulting from employee content.
Sales influence: Number of opportunities where a seller cites employee content as a touchpoint.
Building a simple dashboard
Combine platform analytics with CRM and web analytics to create a single source of truth. A typical dashboard has three panels:
- Activity panel: Posts, shares, and top-performing employees.
- Engagement panel: Impressions, engagement rate, and follower lift.
- Outcome panel: Leads attributed, demo requests, and talent inbound metrics.
Use an employee advocacy solution to centralize post scheduling and analytics. See how built-in reporting can speed analysis on an employee advocacy analytics page.
How to calculate a simple ROI
ROI for personal branding programs is often a mixture of direct revenue and soft value. Use this conservative formula to start:
- Sum direct revenue attributed to employee-driven leads over a period.
- Add estimated value of assisted conversions using a conservative uplift percentage.
- Divide by program cost including platform, content creation, and team time.
This produces a monetary ROI figure you can present to leadership. Be explicit about assumptions and update them with real data over time.
Operational checklist to scale measurement
Apply these practical rules to keep measurement consistent:
- Standardize UTMs and naming conventions across employee campaigns.
- Automate data ingestion from LinkedIn and your advocacy platform into your BI tool.
- Train employees to use trackable links and to tag campaigns in post copy when asked.
- Schedule a monthly review with marketing, sales, and HR to review dashboard insights.
Vulse customers often pair the platform with a CRM to close the loop between post and pipeline. Learn more on our features page about LinkedIn analytics and reporting.
Example: 90-day reporting cadence
Run this lightweight cadence for the first 90 days:
Week 0: Baseline metrics for profiles, impressions, and leads.
Week 1 to 8: Run two focused campaigns and collect UTM-tagged conversions.
Week 12: Produce a stakeholder report with direct revenue, assisted conversions, and talent signal changes.
Repeat and refine goals based on what moves the needle.
Evidence and further reading
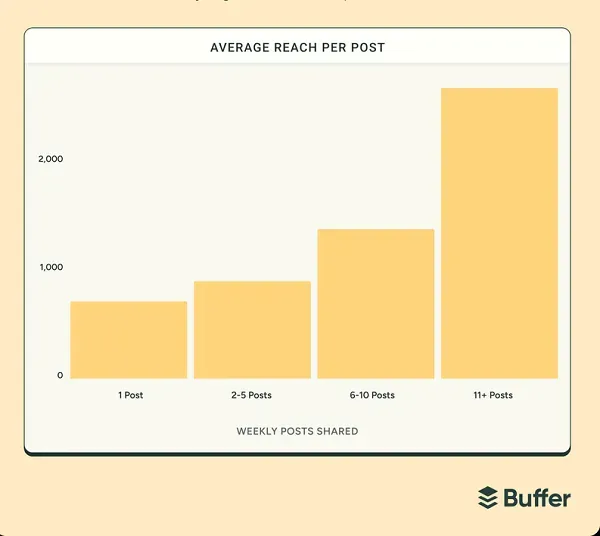
Research shows employee-shared content generates higher trust and click-through rates than brand-only content. For context, LinkedIn's guidance on employee advocacy provides practical benchmarks and best practices, which can help calibrate expectations: LinkedIn Marketing Solutions.
For measuring social ROI and building dashboards, HubSpot's guide to social media ROI is a useful practical resource: HubSpot Blog.
Frequently asked questions
Q: How soon can we expect measurable results?
A: You can see awareness and engagement shifts within 30 days. Attribution to pipeline typically takes 60 to 90 days depending on sales cycles.
Q: Do we need an employee advocacy tool to measure ROI?
A: Tools make tracking and reporting far easier but you can start with manual UTMs and CRM tagging. A platform scales measurement and reduces manual work.
Q: Which metric should executives care about most?
A: That depends on priorities. For revenue-focused leaders show attributed pipeline and deals. For talent-focused teams highlight inbound candidate volume and recruiter touchpoints.