LinkedIn Content Benchmarks 2026: Which Post Format Drives Most Engagement
- LinkedIn Strategy

If you are still guessing which LinkedIn content format to prioritise, new benchmark data from 1.3 million posts makes the answer clear: native document posts (uploaded PDFs displayed as carousels) generate the highest engagement rate of any content type on the platform at 7.00%, followed by multi-image posts at 6.45% and video at 6.00%.
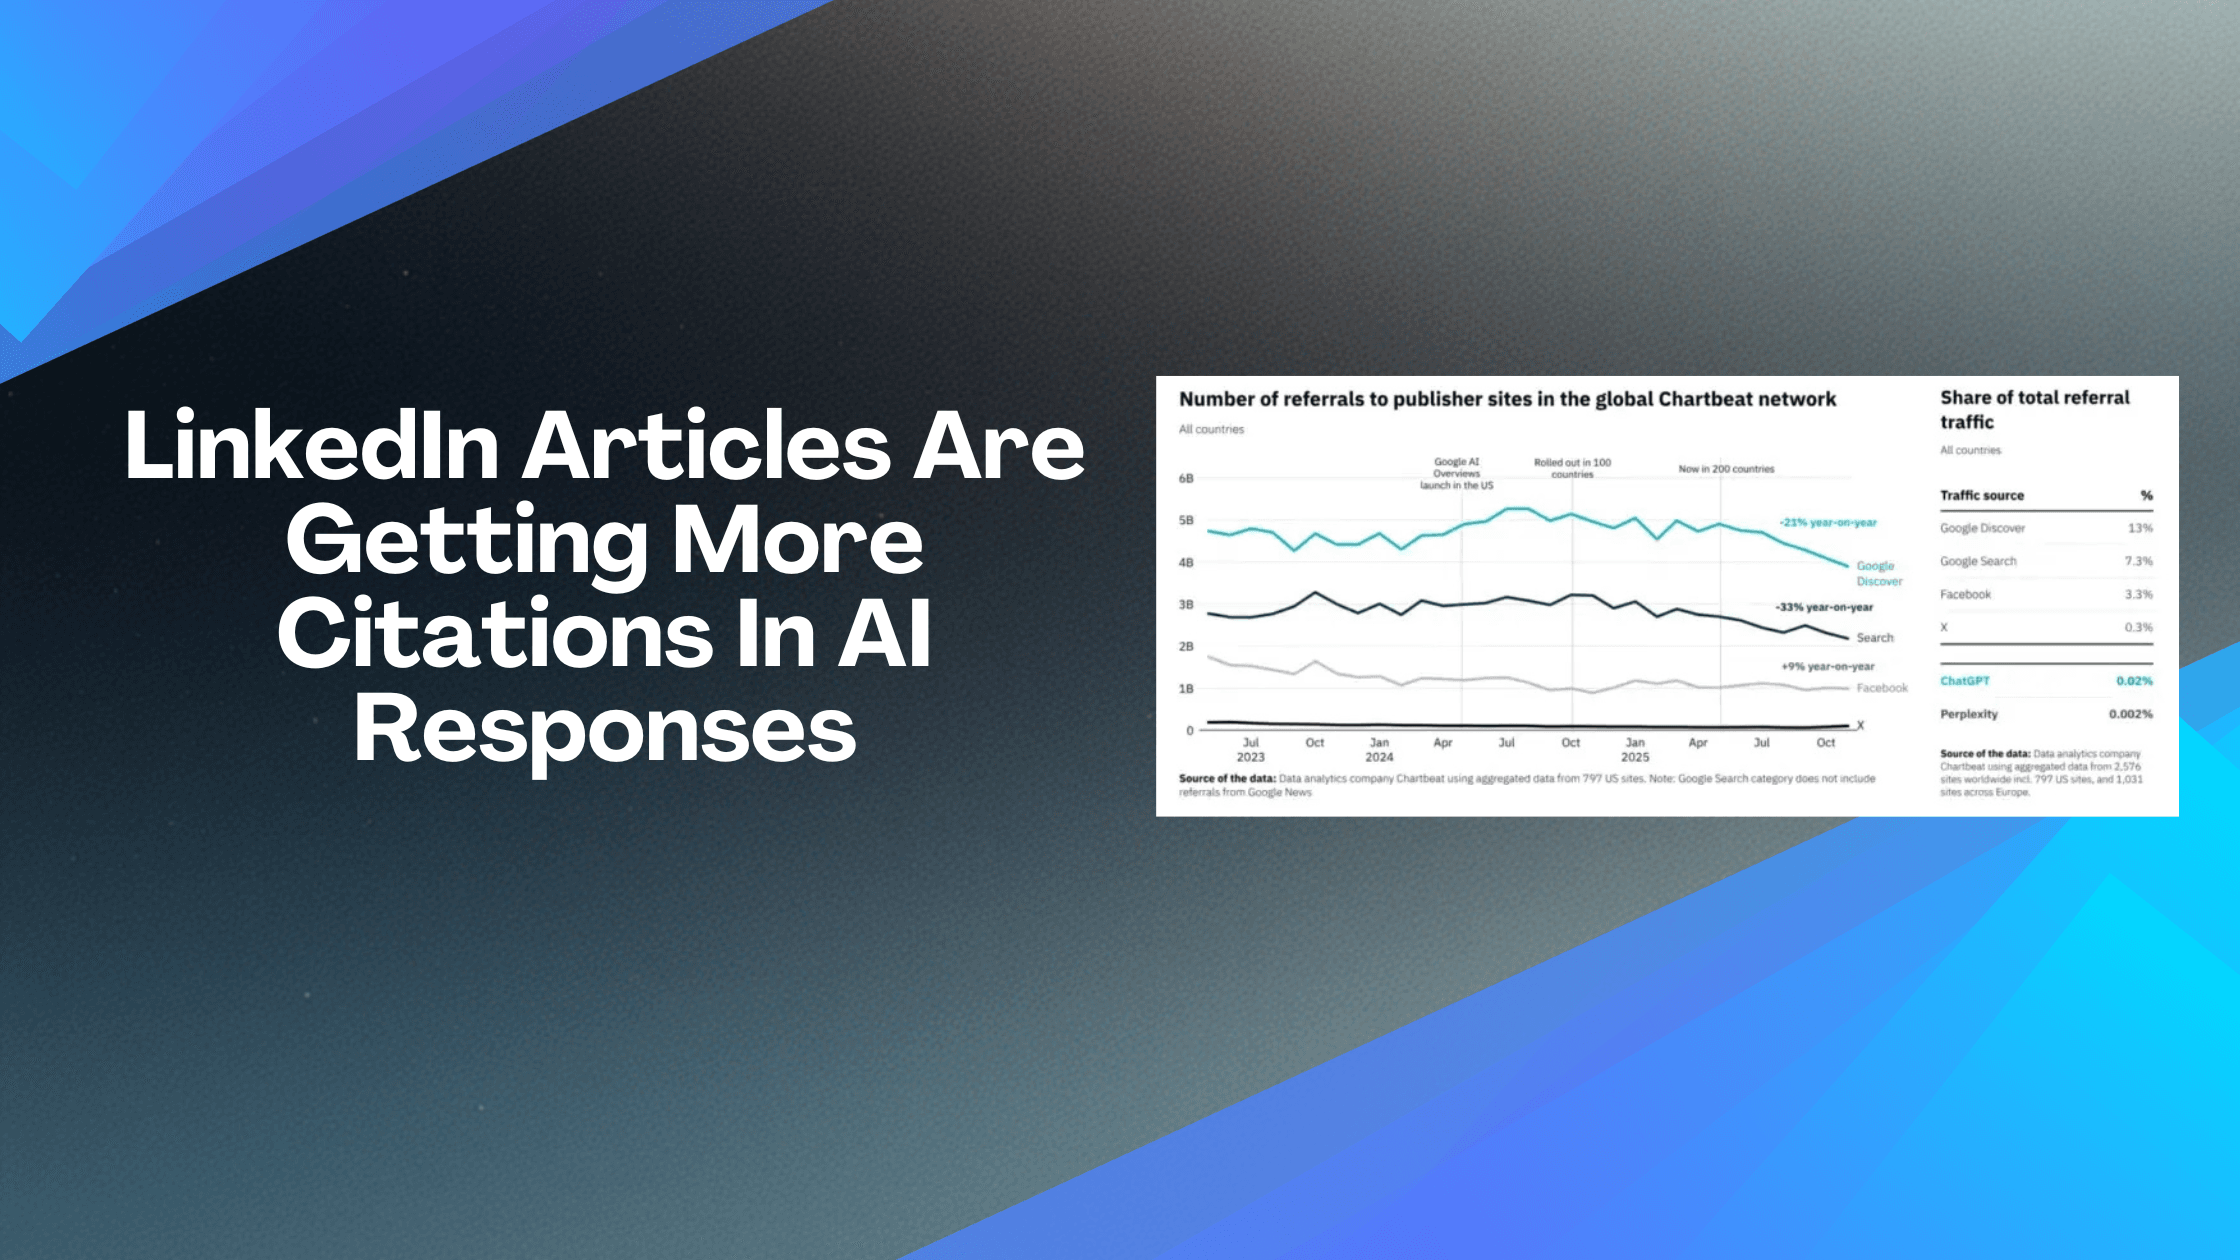
This matters because LinkedIn's overall engagement rate has actually increased 8% year-over-year to an average of 5.20%, even as organic reach continues to decline. The platform is rewarding depth and substance over volume, and the formats that keep people on the page longest are winning.
This guide breaks down the latest Socialinsider 2026 LinkedIn Benchmarks data, explains what it means for your content strategy, and shows how employee advocacy programmes can use these insights to maximise performance.
Document Posts Now Outperform Every Other LinkedIn Format
The biggest finding from the Socialinsider study is that native document posts have overtaken all other content types for engagement. As Social Media Today reported, this is a significant departure from other social platforms where short-form video dominates.
Here is how each format performed based on average engagement rate by impressions in 2025:
Native documents: 7.00% (up 14% year-over-year)
Multi-image posts: 6.45%
Video: 6.00% (up 7% YoY)
Image: 5.30% (up 9% YoY)
Text: 4.50% (up 12% YoY)
Poll: 4.20%
Link: 3.25%
The year-over-year trend is notable. Engagement grew across every content format except polls and links. Document posts saw the largest increase at 14%, but even simple text posts climbed 12%. LinkedIn users are engaging more across the board.
Julia Holmqvist, Social Media Manager at Semrush, explained the document trend well in the Socialinsider report: documents perform because they deliver downloadable, practical value like frameworks, templates, and checklists in a format that is easy to scan and save for later.
This aligns with what LinkedIn's own algorithm now rewards: dwell time. Document carousels require swiping through multiple slides, which keeps users on the post longer than almost any other format. That extended attention signals quality to the algorithm and triggers broader distribution.
Multi-Image Posts Drive the Most Likes
While documents lead on overall engagement rate, the data shows a different winner for likes specifically: multi-image posts generate the most likes across every page size.
For pages with 100K to 1M followers, multi-image posts average 180 likes per post compared to 155 for video and 30 for native documents. The pattern holds for smaller pages too, though at lower absolute numbers.
This creates a useful strategic distinction. If your goal is overall engagement (comments, shares, saves, clicks), prioritise documents. If your immediate goal is social proof through visible like counts, multi-image posts are your best option.
For employee advocacy content, this distinction matters. Employees sharing document carousels will generate deeper engagement that drives profile visits and conversations. Employees sharing multi-image posts will generate higher visible reaction counts that build credibility in the feed. Both have a place in a well-rounded advocacy programme.
Video Views Are Declining Despite More Video Being Posted
One of the most counterintuitive findings in the data is that LinkedIn video views dropped 36% year-over-year across all page sizes, even as brands doubled their video posting frequency from 2 to 4 posts per month.
The decline is consistent across every audience tier. Pages with 10K to 50K followers saw average video views drop from 1,000 to 585. Even the largest pages (100K to 1M followers) saw views fall from 2,430 to 1,380.
This does not mean video is dead on LinkedIn. Video still generates a 6.00% engagement rate, which is above the platform average. But it does suggest that the market is saturated with video content, and the returns are diminishing as more brands compete for attention in the same format.
The Socialinsider report includes a useful insight from Semrush's social team: LinkedIn is not a video-first platform the way TikTok or Instagram are. Users do not open LinkedIn to scroll through video feeds. They come for professional knowledge sharing, and the formats built for that purpose (documents, text, images) are outperforming video on the metrics that matter.
For employee advocacy, this reinforces the case for document carousels and well-crafted text posts over video. Most employees are more comfortable creating a PDF or writing a text post than recording and editing video, and the data shows those formats perform just as well or better.
Impressions Vary Dramatically by Page Size and Format
The benchmark data reveals how much content performance depends on audience size. The right format for a page with 5,000 followers is not the same as the right format for a page with 100,000.
For pages with under 50K followers, multi-image posts consistently generate the most impressions per post. A page with 10K to 50K followers averages 1,850 impressions per multi-image post compared to 1,420 for video and 1,150 for native documents.
For pages with over 50K followers, polls become the highest-impression format. Pages with 100K to 1M followers average 9,797 impressions per poll compared to 3,867 for multi-image posts.
This is a significant finding for employee advocacy. Most employee LinkedIn profiles have follower counts in the low thousands, which means the multi-image and document formats are their best options for maximising both reach and engagement. Polls may work well for executive profiles with larger followings but are less effective for the broader employee base.
Posting Frequency Is Increasing Across Visual Formats
Brands are posting more on LinkedIn, particularly in visual formats. Image posts increased from an average of 5 to 7 per month. Video doubled from 2 to 4 per month. Native document posts rose from 1 to 2 per month.
This increase in posting frequency aligns with Buffer's finding that top-performing LinkedIn accounts post more frequently and more consistently than the median account. The "no-post penalty" is real: accounts that skip a week consistently underperform their own baseline growth rate.
For employee advocacy programmes, the practical takeaway is straightforward. Encourage employees to post at least 2 to 3 times per week. Provide them with a mix of content formats, particularly documents and multi-image posts. And make the content creation process as frictionless as possible so consistency does not feel like a burden.
Our employee advocacy training guide covers how to build posting habits that sustain momentum without burning employees out.
Audience Growth Is Slowing, Especially for Large Pages
LinkedIn follower growth rates declined across every page size in 2025. Pages with 1K to 5K followers still saw a respectable 24.5% average growth rate, but pages with 100K to 1M followers saw growth slow sharply to just 6.4%, down from 21.6% the previous year.
This slowdown has a direct strategic implication: growing an audience through your company page alone is increasingly difficult. The brands that maintain healthy growth rates are those that supplement company page content with employee-driven distribution.
Our analysis of 400 million LinkedIn impressions found that employee posts generate 14 times more engagement than company page content. When audience growth on your company page stalls, activating employee voices is the most effective lever available. Employee networks are roughly 12 times larger than company follower bases, and the LinkedIn algorithm allocates approximately 65% of feed real estate to personal profiles versus just 5% for company pages.
What This Means for Your LinkedIn Strategy in 2026
The Socialinsider data points to a clear set of priorities for marketing teams.
Lead with documents and carousels. They generate the highest engagement rate and align with what LinkedIn's algorithm rewards: dwell time and substantive content. Invest in creating original frameworks, research summaries, checklists, and guides in PDF format.
Use multi-image posts for visibility and social proof. When you need likes and impressions rather than deep engagement, multi-image posts are consistently the top performer across page sizes under 50K followers.
Be strategic with video. Video still works on LinkedIn, but the declining returns mean it should complement your strategy rather than dominate it. Use video for content that genuinely benefits from the format, like executive interviews, behind-the-scenes footage, or product demonstrations, rather than defaulting to video for everything.
Post consistently. Frequency matters. The data shows brands are increasing output across visual formats, and top performers post more often and more consistently than average accounts. Aim for at least 2 to 3 posts per week per employee in your advocacy programme.
Invest in employee advocacy. With company page growth slowing and the algorithm favouring personal profiles, employee-driven content is the highest-leverage organic strategy available. Equip your team with document templates, multi-image assets, and clear guidelines. For practical guidance on getting started, see our employee advocacy buyer's guide.
Personalise everything. The algorithm penalises mass-identical resharing. When employees share content from your advocacy programme, even a single line of personal commentary transforms a templated share into authentic content that performs dramatically better.
Frequently Asked Questions
What is the best content format on LinkedIn in 2026?
Native document posts (uploaded PDFs displayed as carousels) generate the highest average engagement rate at 7.00%, according to Socialinsider's analysis of 1.3 million LinkedIn posts. Multi-image posts follow at 6.45%, and video at 6.00%.
What is a good engagement rate on LinkedIn?
LinkedIn's overall average engagement rate by impressions is 5.20% in 2026. Content above this threshold is performing better than typical. Native documents average 7.00%, making them the format most likely to exceed the benchmark.
Are LinkedIn video views declining?
Yes. Average video views dropped 36% year-over-year across all page sizes, even as brands doubled their video posting frequency. Video still generates above-average engagement rates, but the returns are diminishing as more content competes in the format.
How often should a company post on LinkedIn?
Benchmark data shows brands are increasing their posting frequency, particularly for images (7 per month) and video (4 per month). Top-performing accounts post more frequently and consistently than the median. For employee advocacy, aim for 2 to 3 posts per week per advocate.
Why is LinkedIn audience growth slowing?
Follower growth rates declined across all page sizes in 2025. Pages with 100K+ followers saw the sharpest slowdown, from 21.6% to 6.4% average growth. The brands maintaining growth are those supplementing company page content with employee-driven distribution through advocacy programmes.
Do document posts work for employee advocacy?
Yes. Documents are an ideal format for employee advocacy because they showcase expertise through practical resources like frameworks, checklists, and research summaries. They generate the highest engagement rate on the platform and align with what LinkedIn's algorithm rewards: dwell time and substantive content.
Ready to equip your team with the content formats that actually work on LinkedIn? Vulse helps marketing teams create, distribute, and measure employee content that drives real engagement. Start your free trial or book a demo to see how it works.