EMPLOYEE ADVOCACY STATISTICS
Employee Advocacy Statistics for 2026
Every employee advocacy statistic worth quoting, in one place, with the publisher and year attached. Reach, engagement, trust, pipeline, recruitment, participation and ROI, ready for your next board paper. Last updated August 2026.
Employee Advocacy Statistics at a Glance
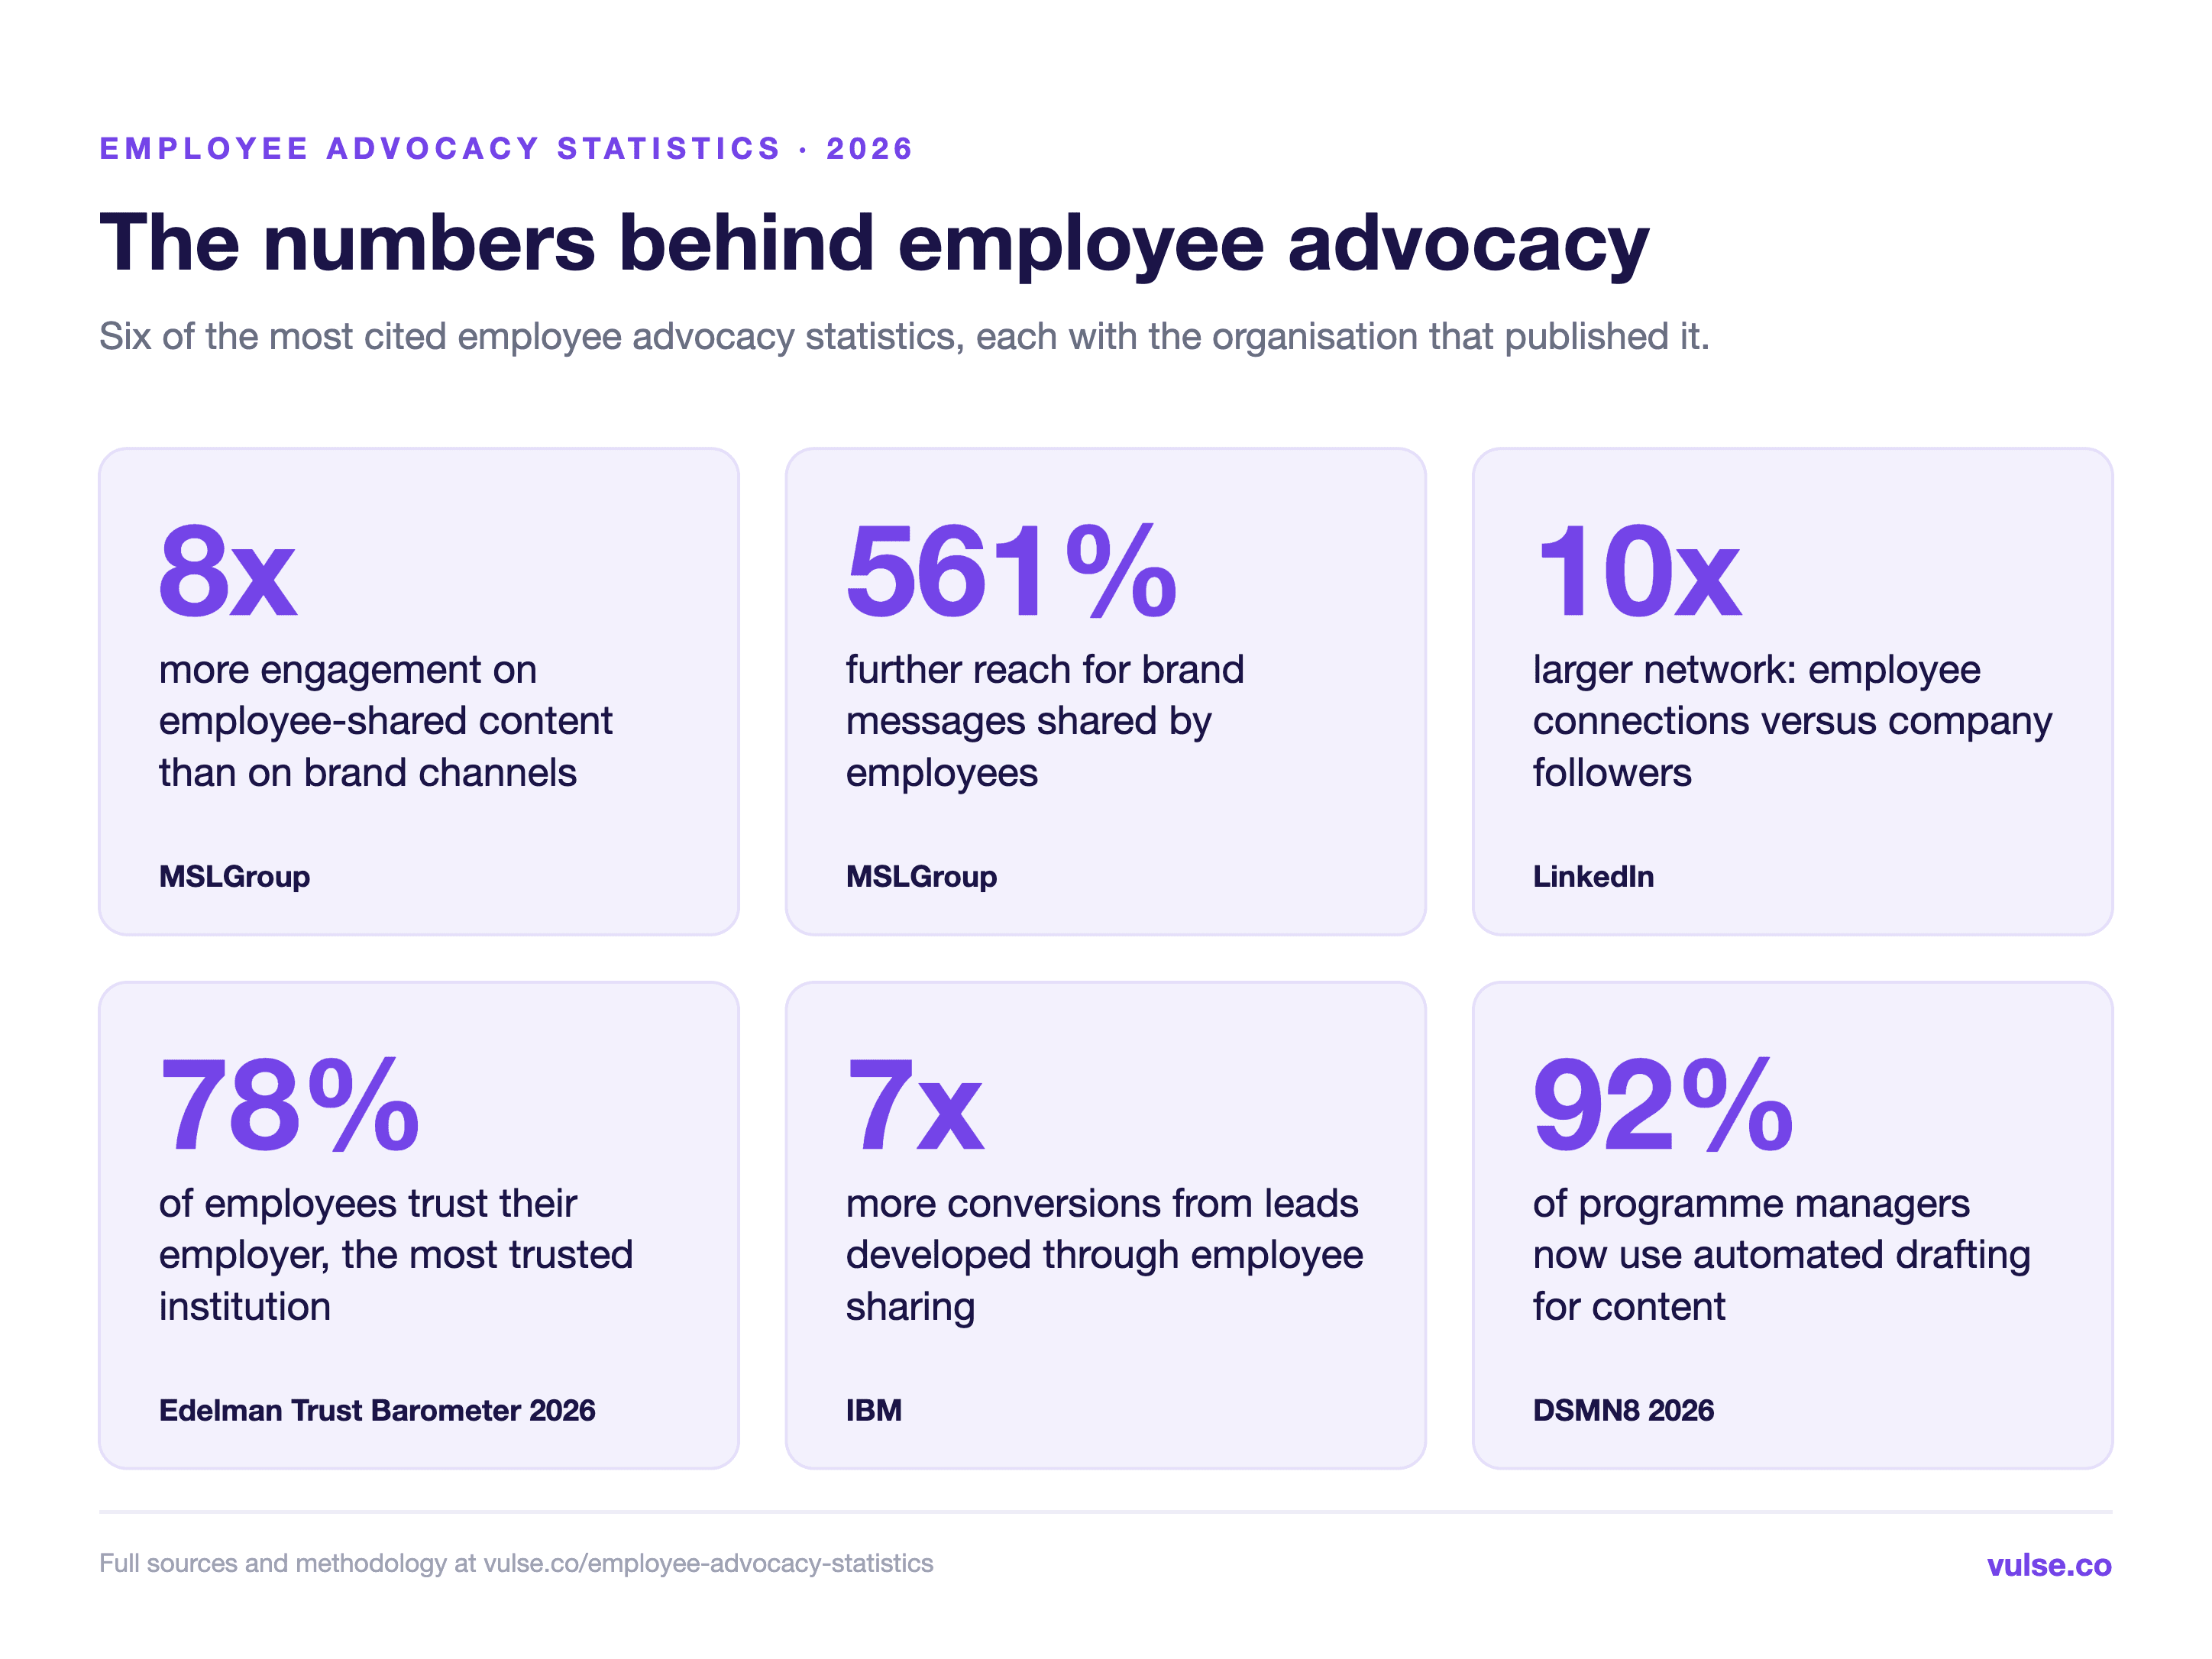
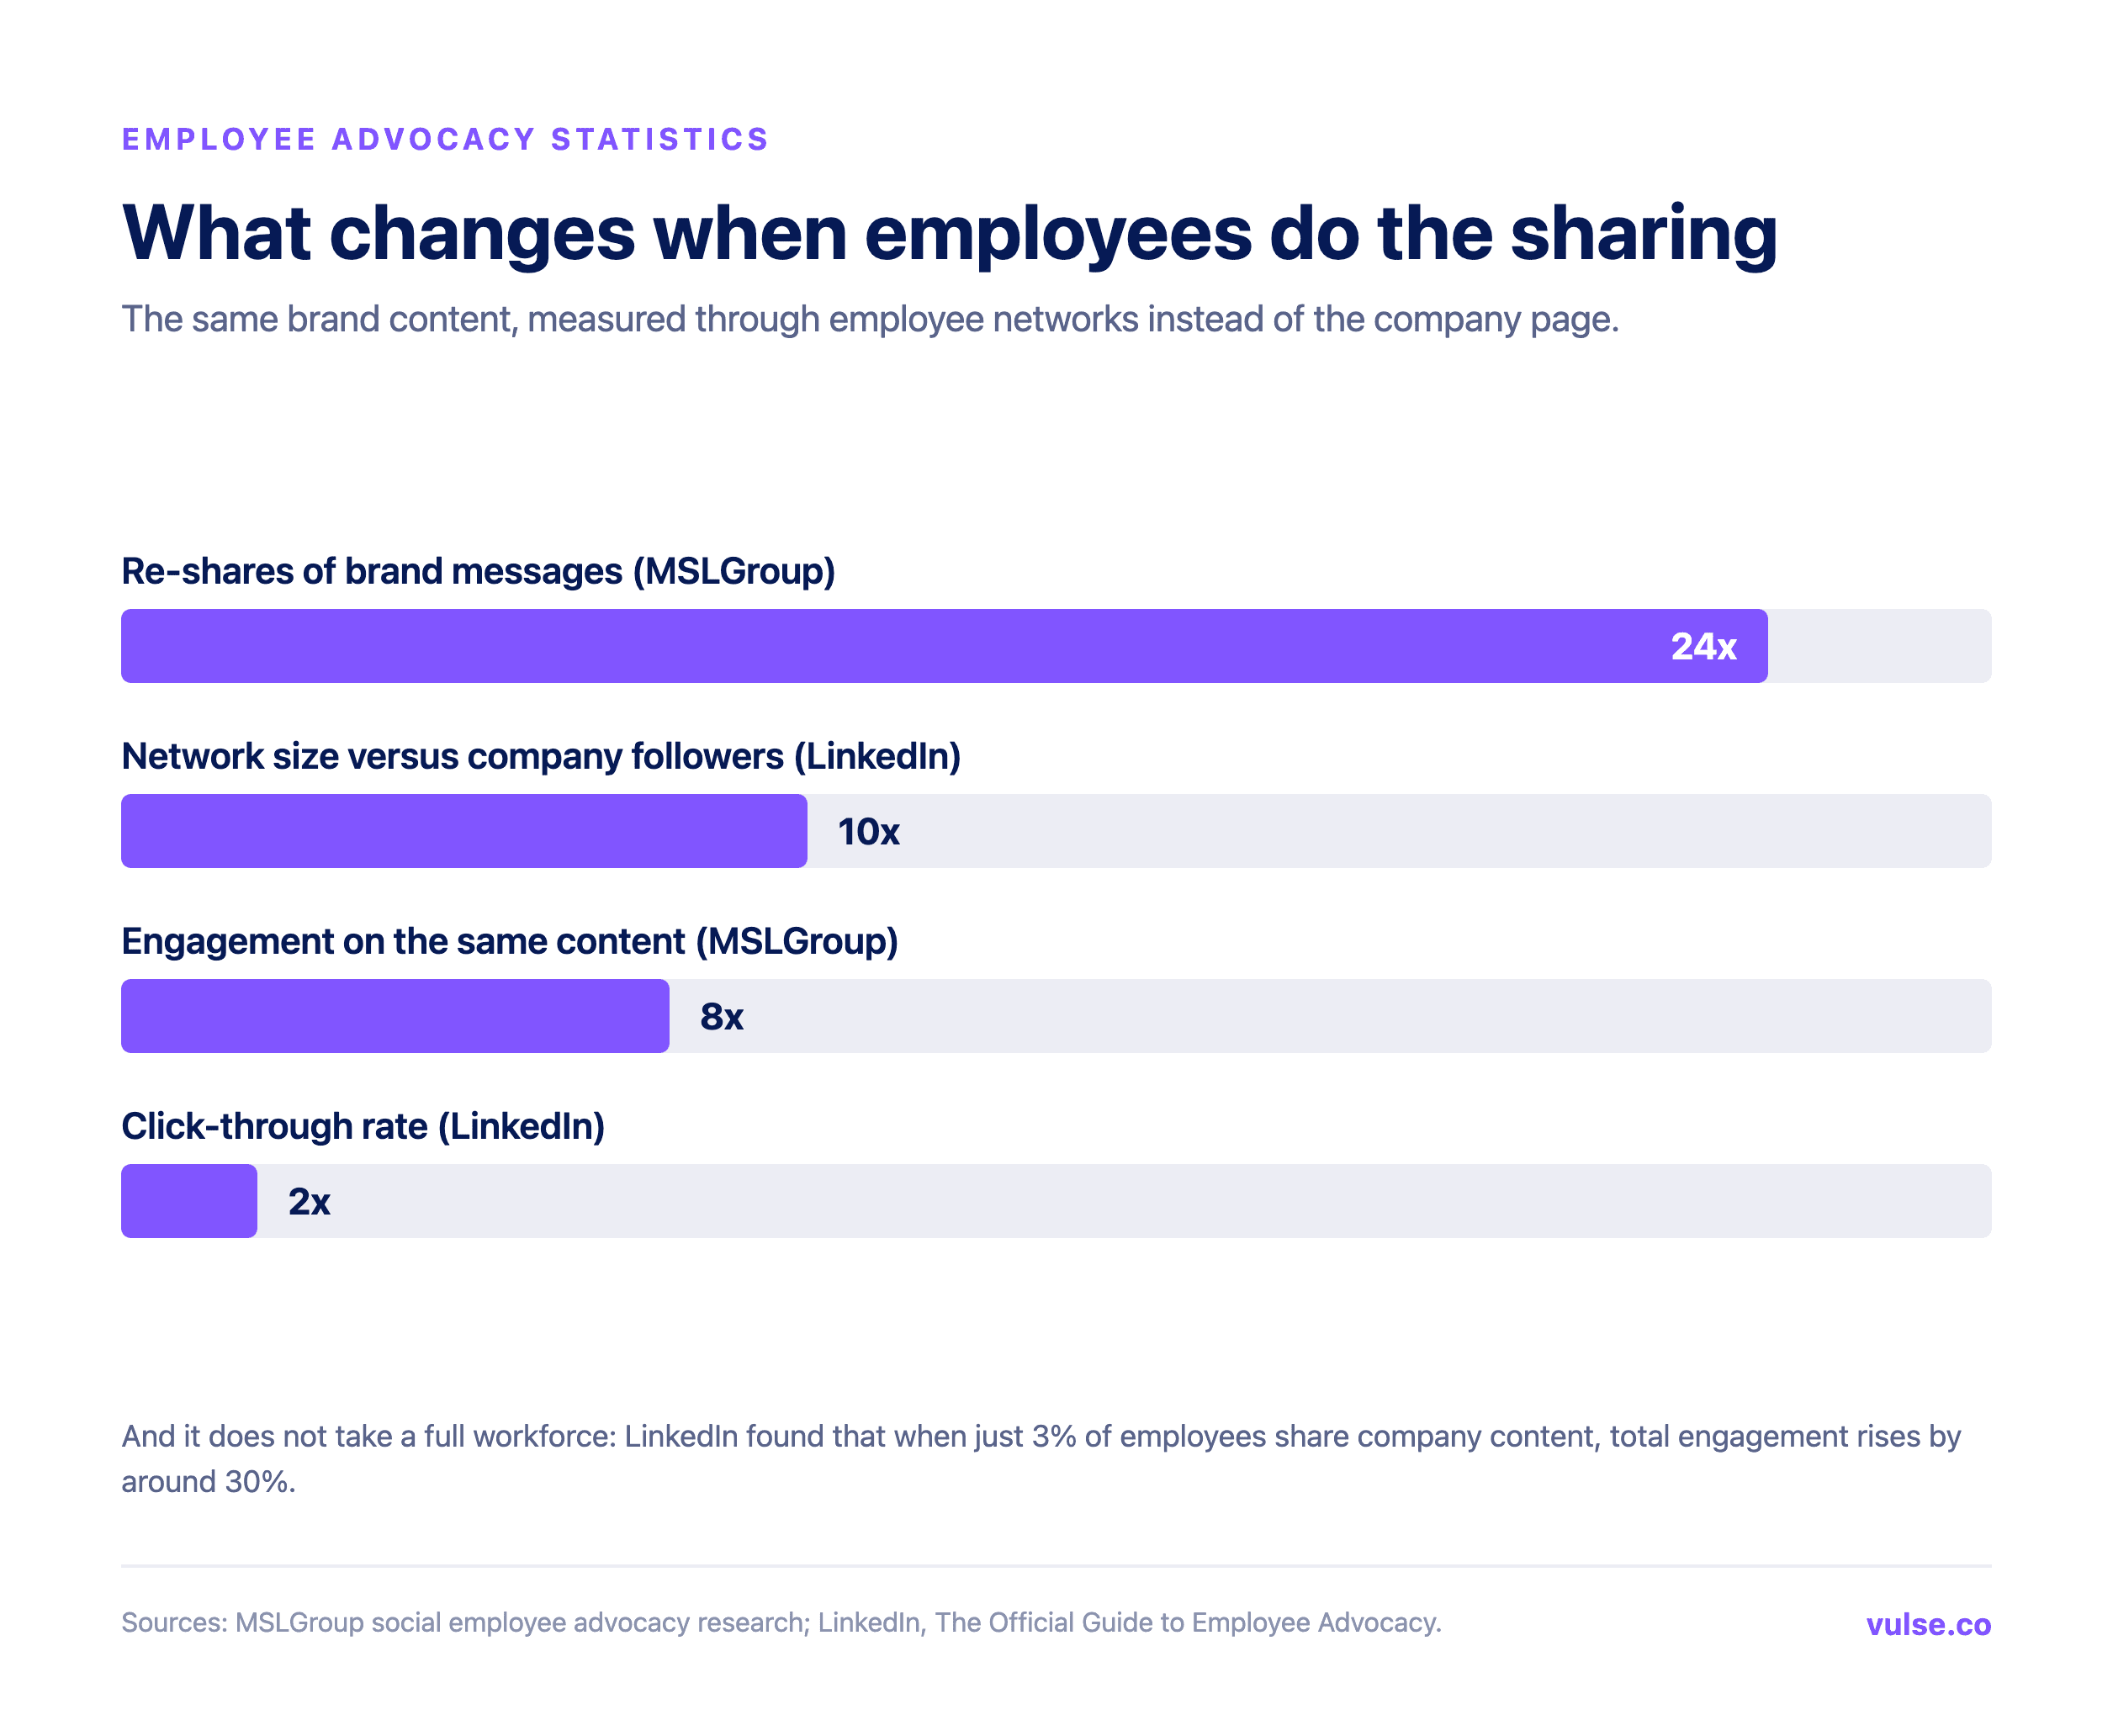
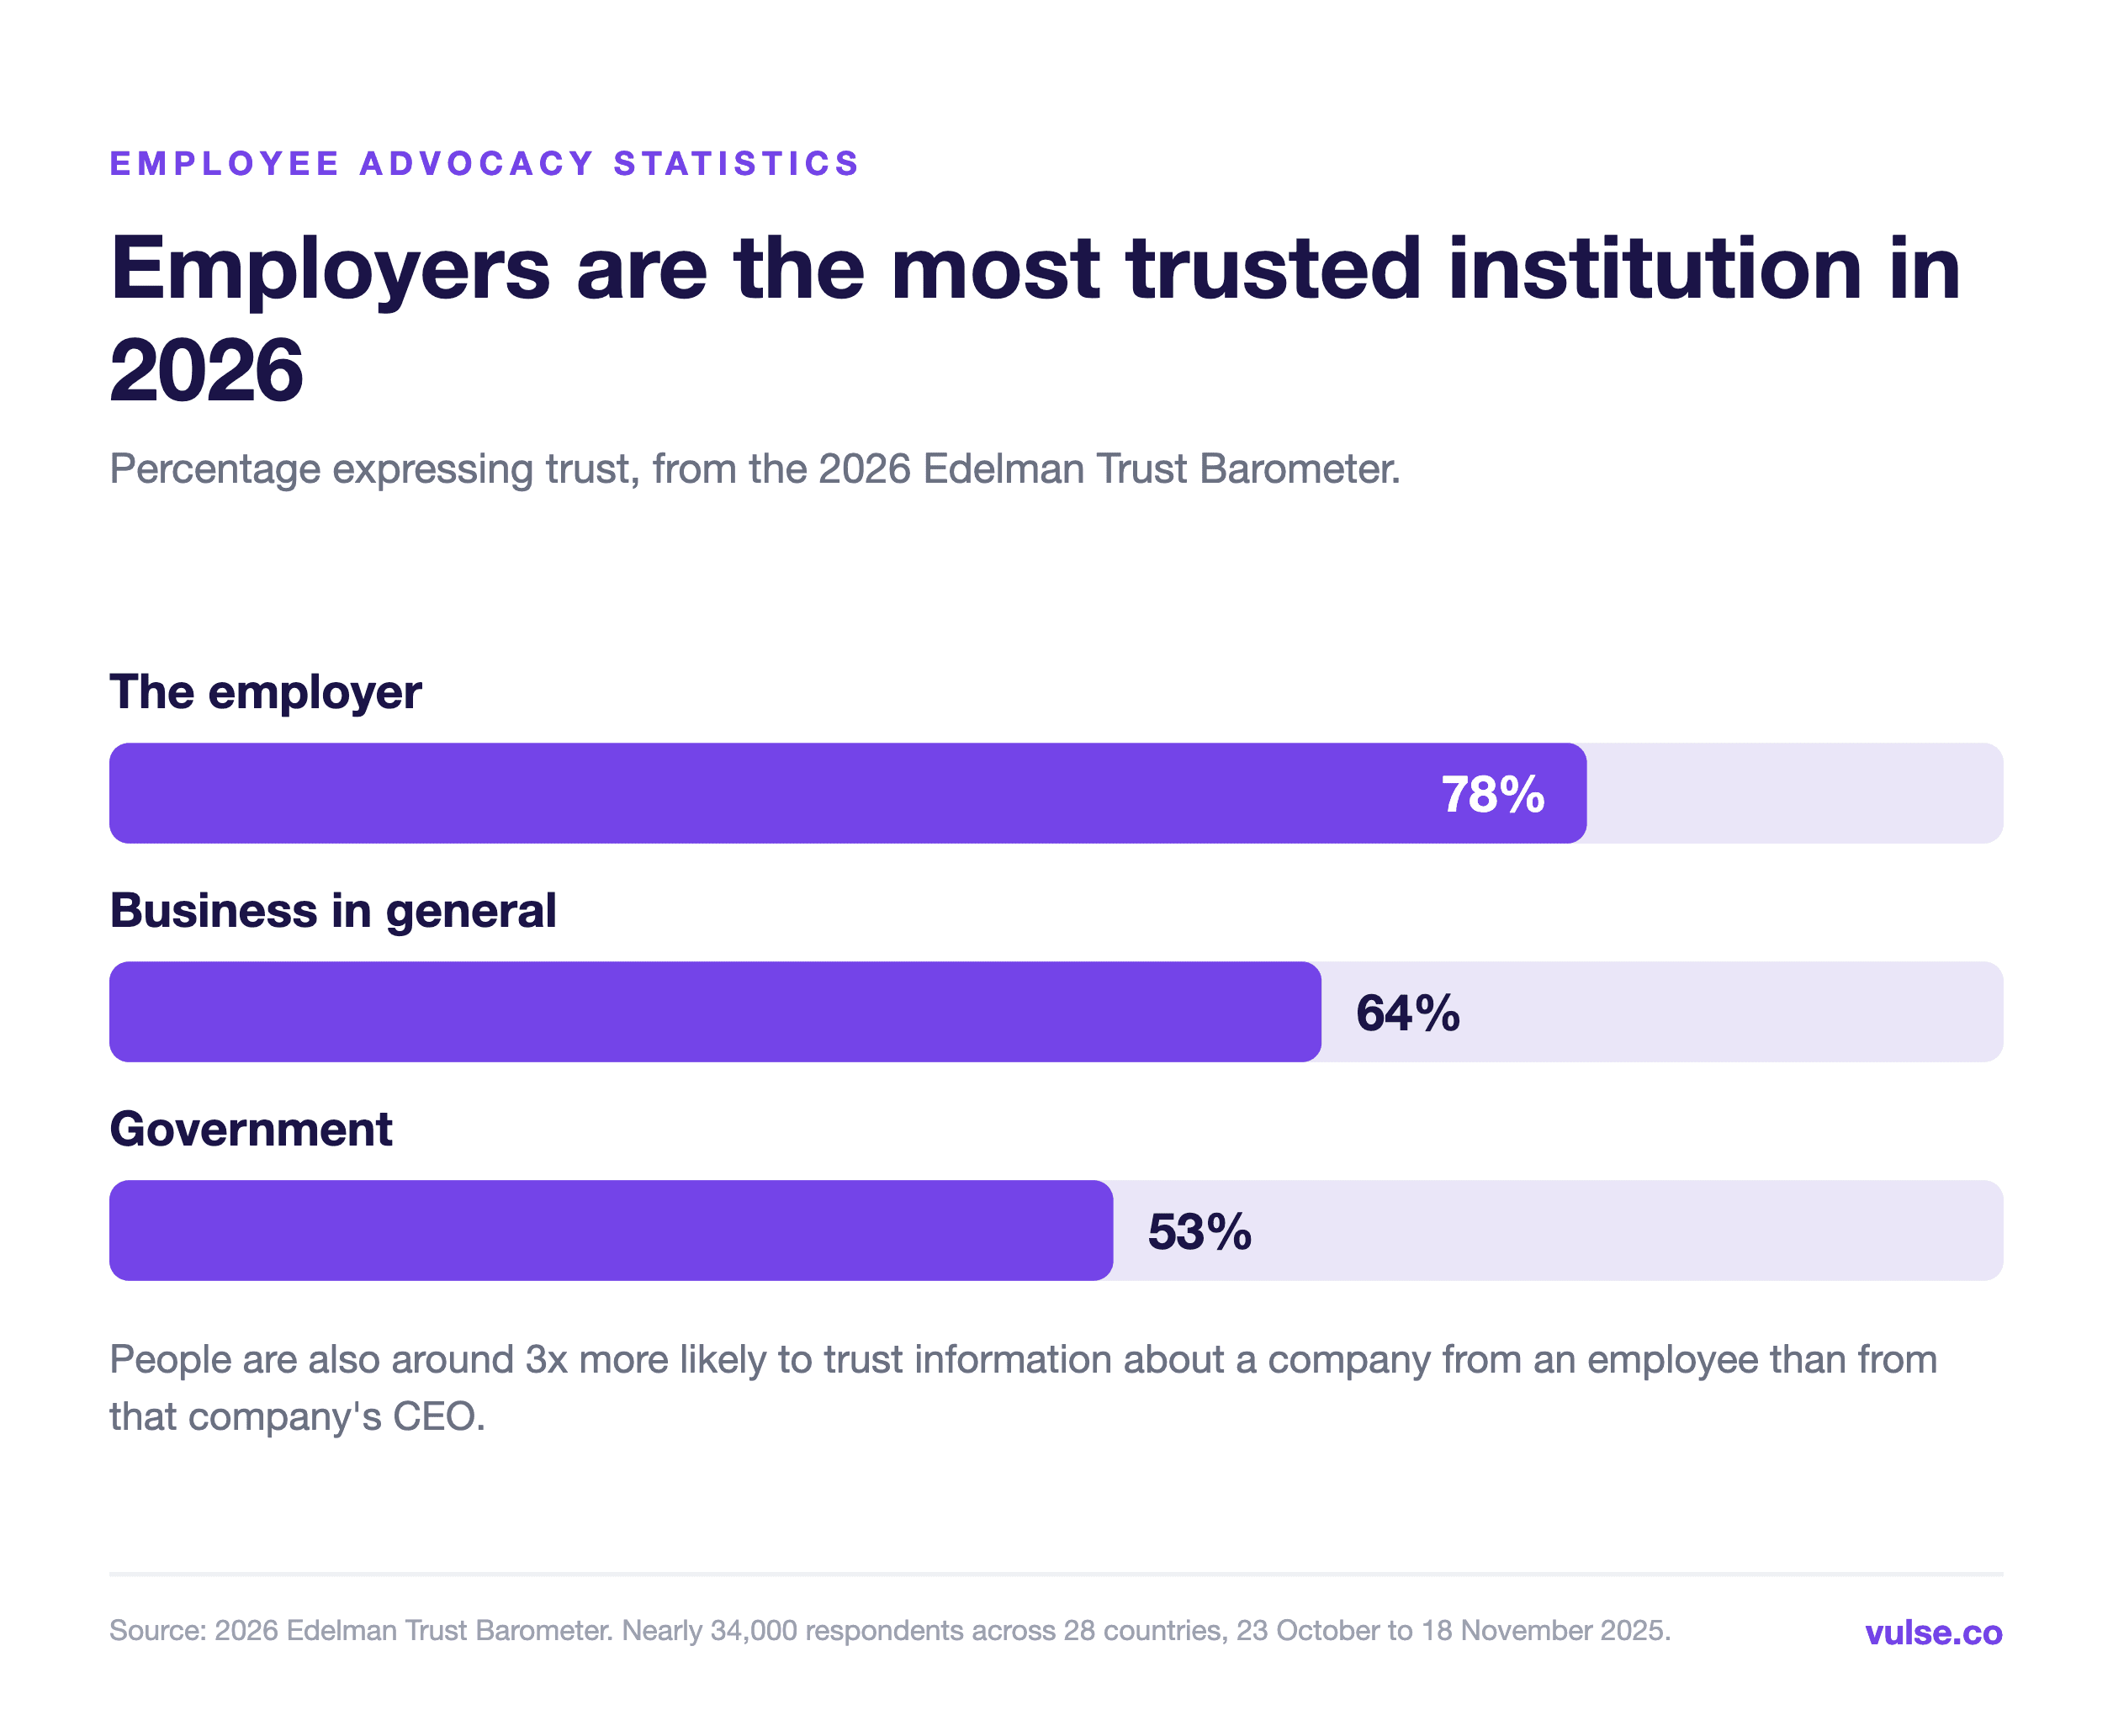
If you only take one thing from this page, make it this: people believe people more than they believe logos. Content shared by employees earns around 8x more engagement than the identical post on a brand channel, and brand messages travel 561% further through employee networks (MSLGroup). The maths is simple and persuasive. Your colleagues hold roughly 10x more connections than your company page has followers, and what they share gets about twice the click-through rate (LinkedIn, The Official Guide to Employee Advocacy). A small group is enough. LinkedIn found that when just 3% of employees share company content, overall engagement climbs by about 30%. And the trust is already banked: 78% of employees worldwide say they trust their employer, 14 points ahead of business in general and 25 ahead of government (2026 Edelman Trust Barometer, nearly 34,000 respondents across 28 countries).
Reach and Amplification Statistics
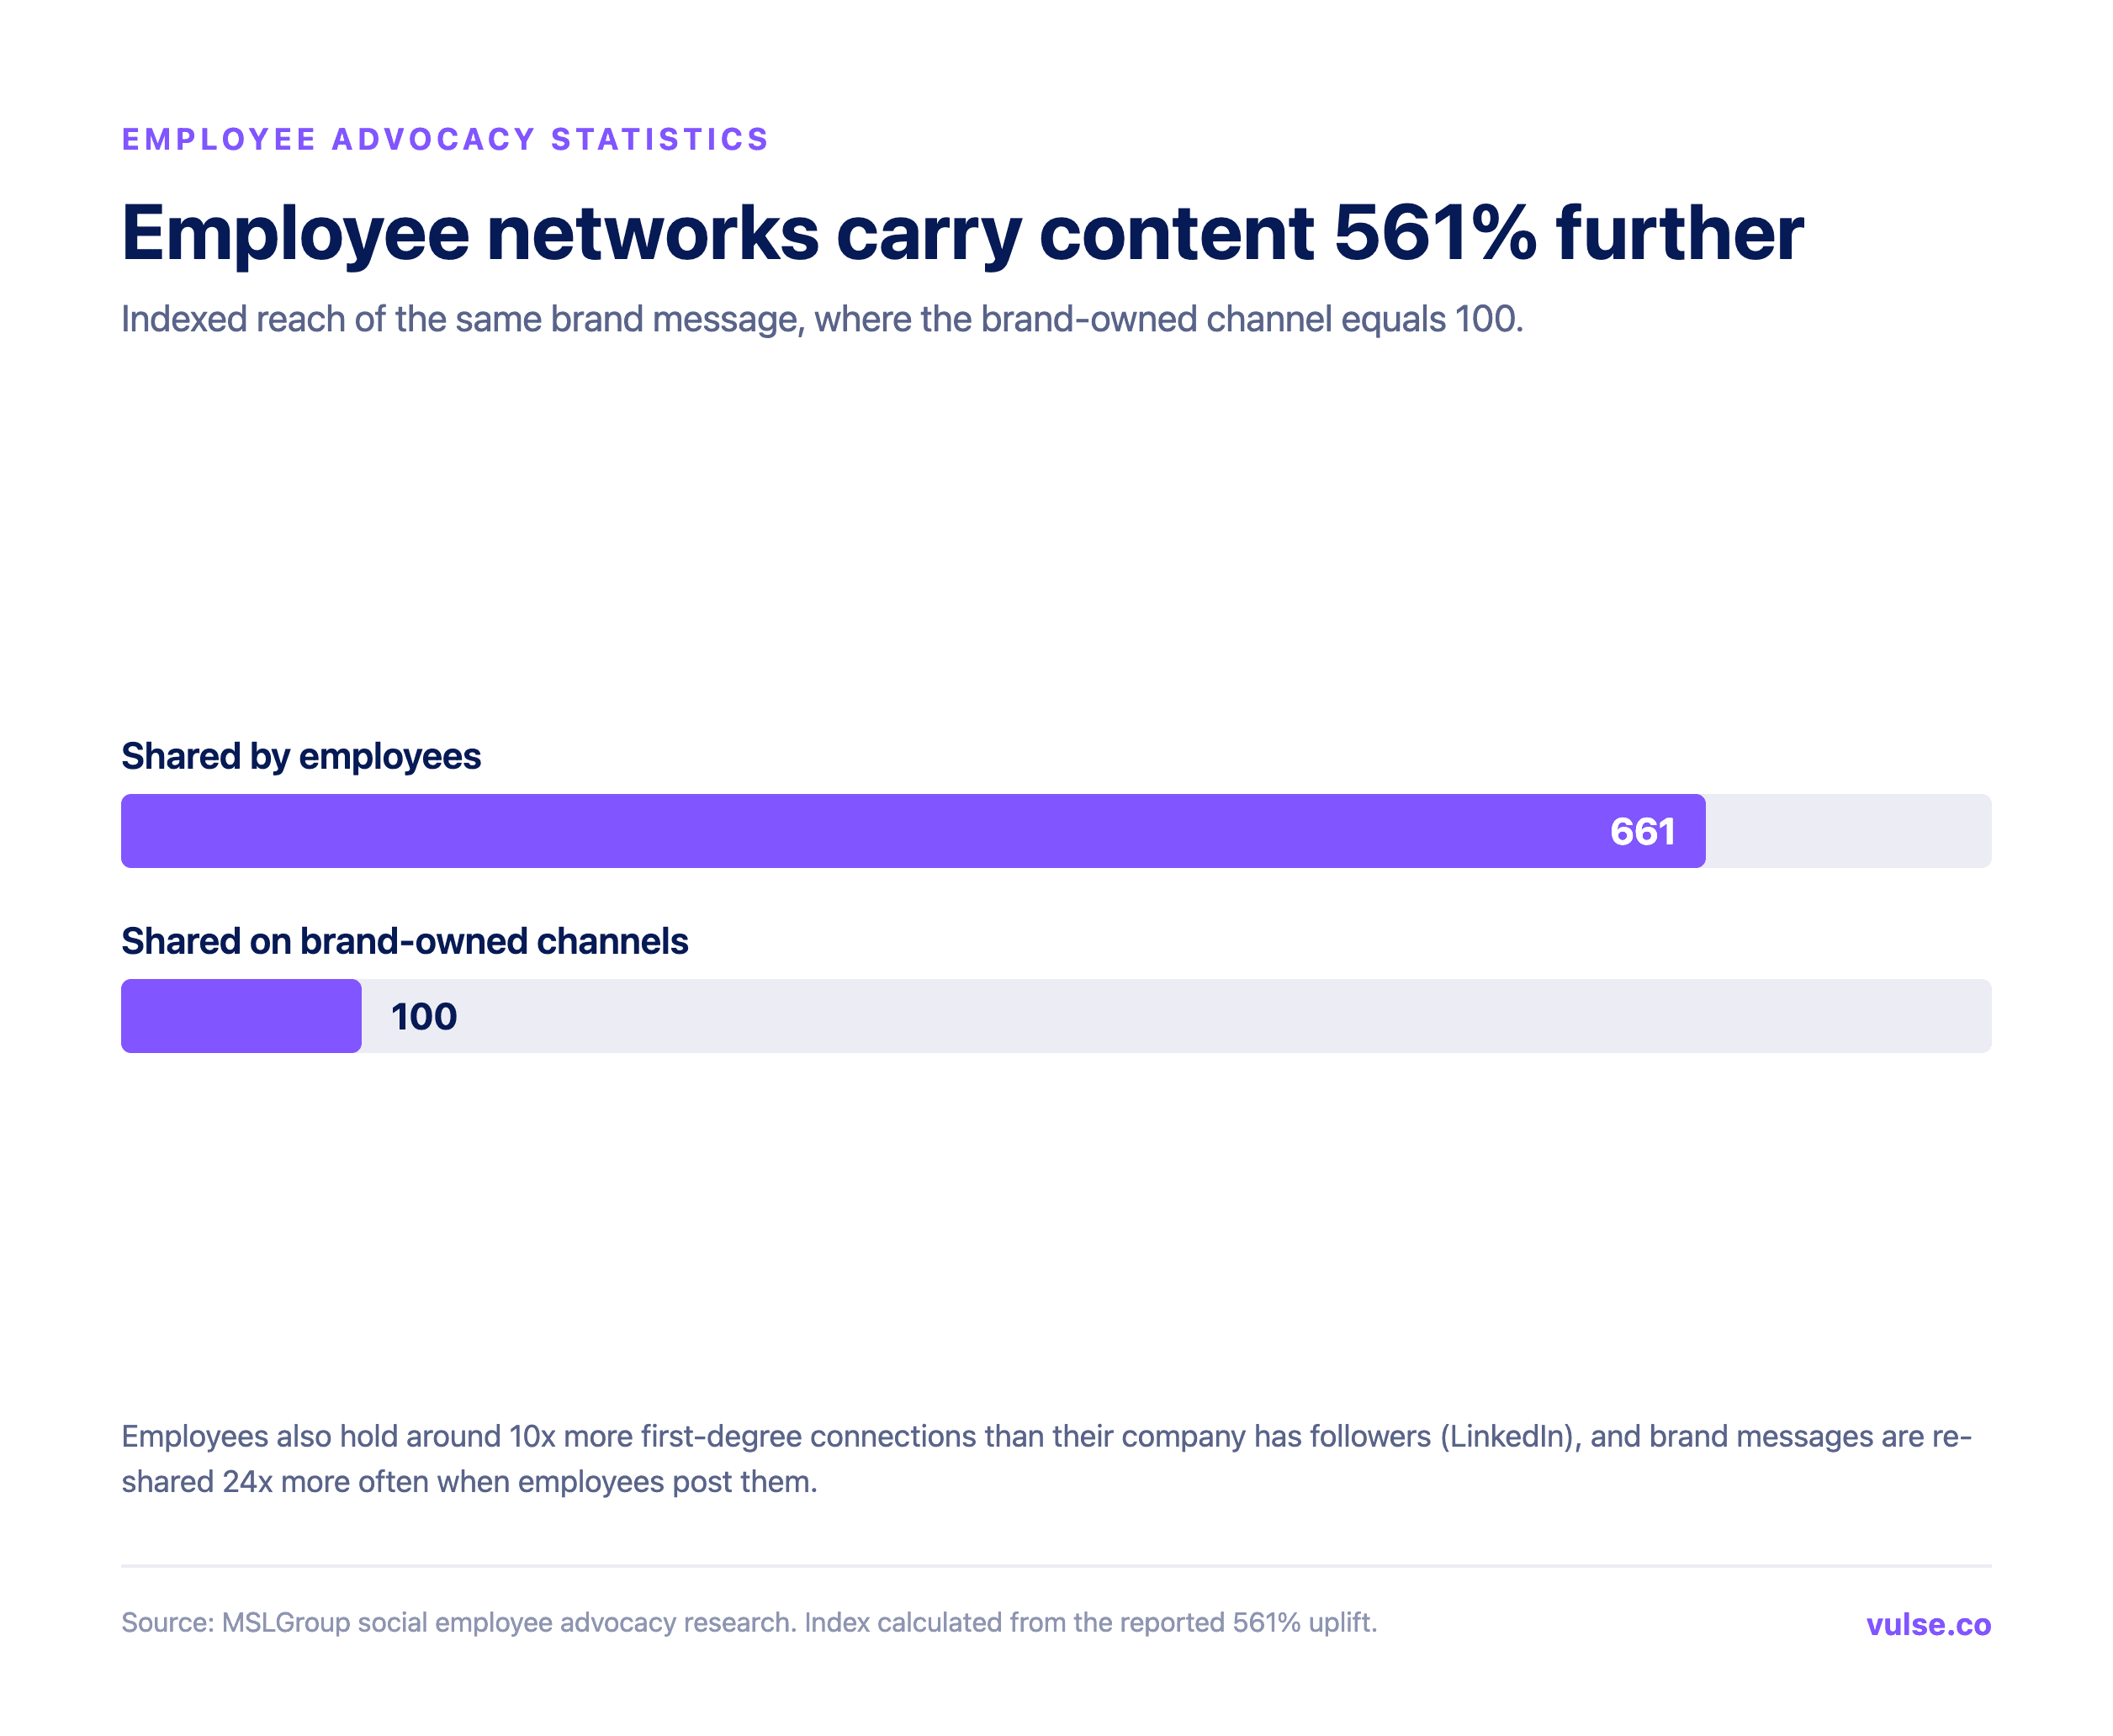
Advocacy is distribution first and content second. The same message reaches 561% further and gets re-shared 24x more often when it leaves through employee networks rather than the brand account (MSLGroup). The reason is simple. The average employee's network is around 10x bigger than their employer's follower count (LinkedIn). Fresh platform data backs the older finding, too. Metricool's 2026 study of 673,658 LinkedIn posts across 63,108 accounts found personal profiles earn roughly 63% more engagement than company pages, and only 7% of company pages grew enough in a year to climb a follower tier. Programme managers see the same thing from the inside: respondents to DSMN8's 2026 benchmark report close to 8x the reach of their corporate channels, and 36% call increased brand visibility the single biggest benefit they have had.
Engagement Statistics
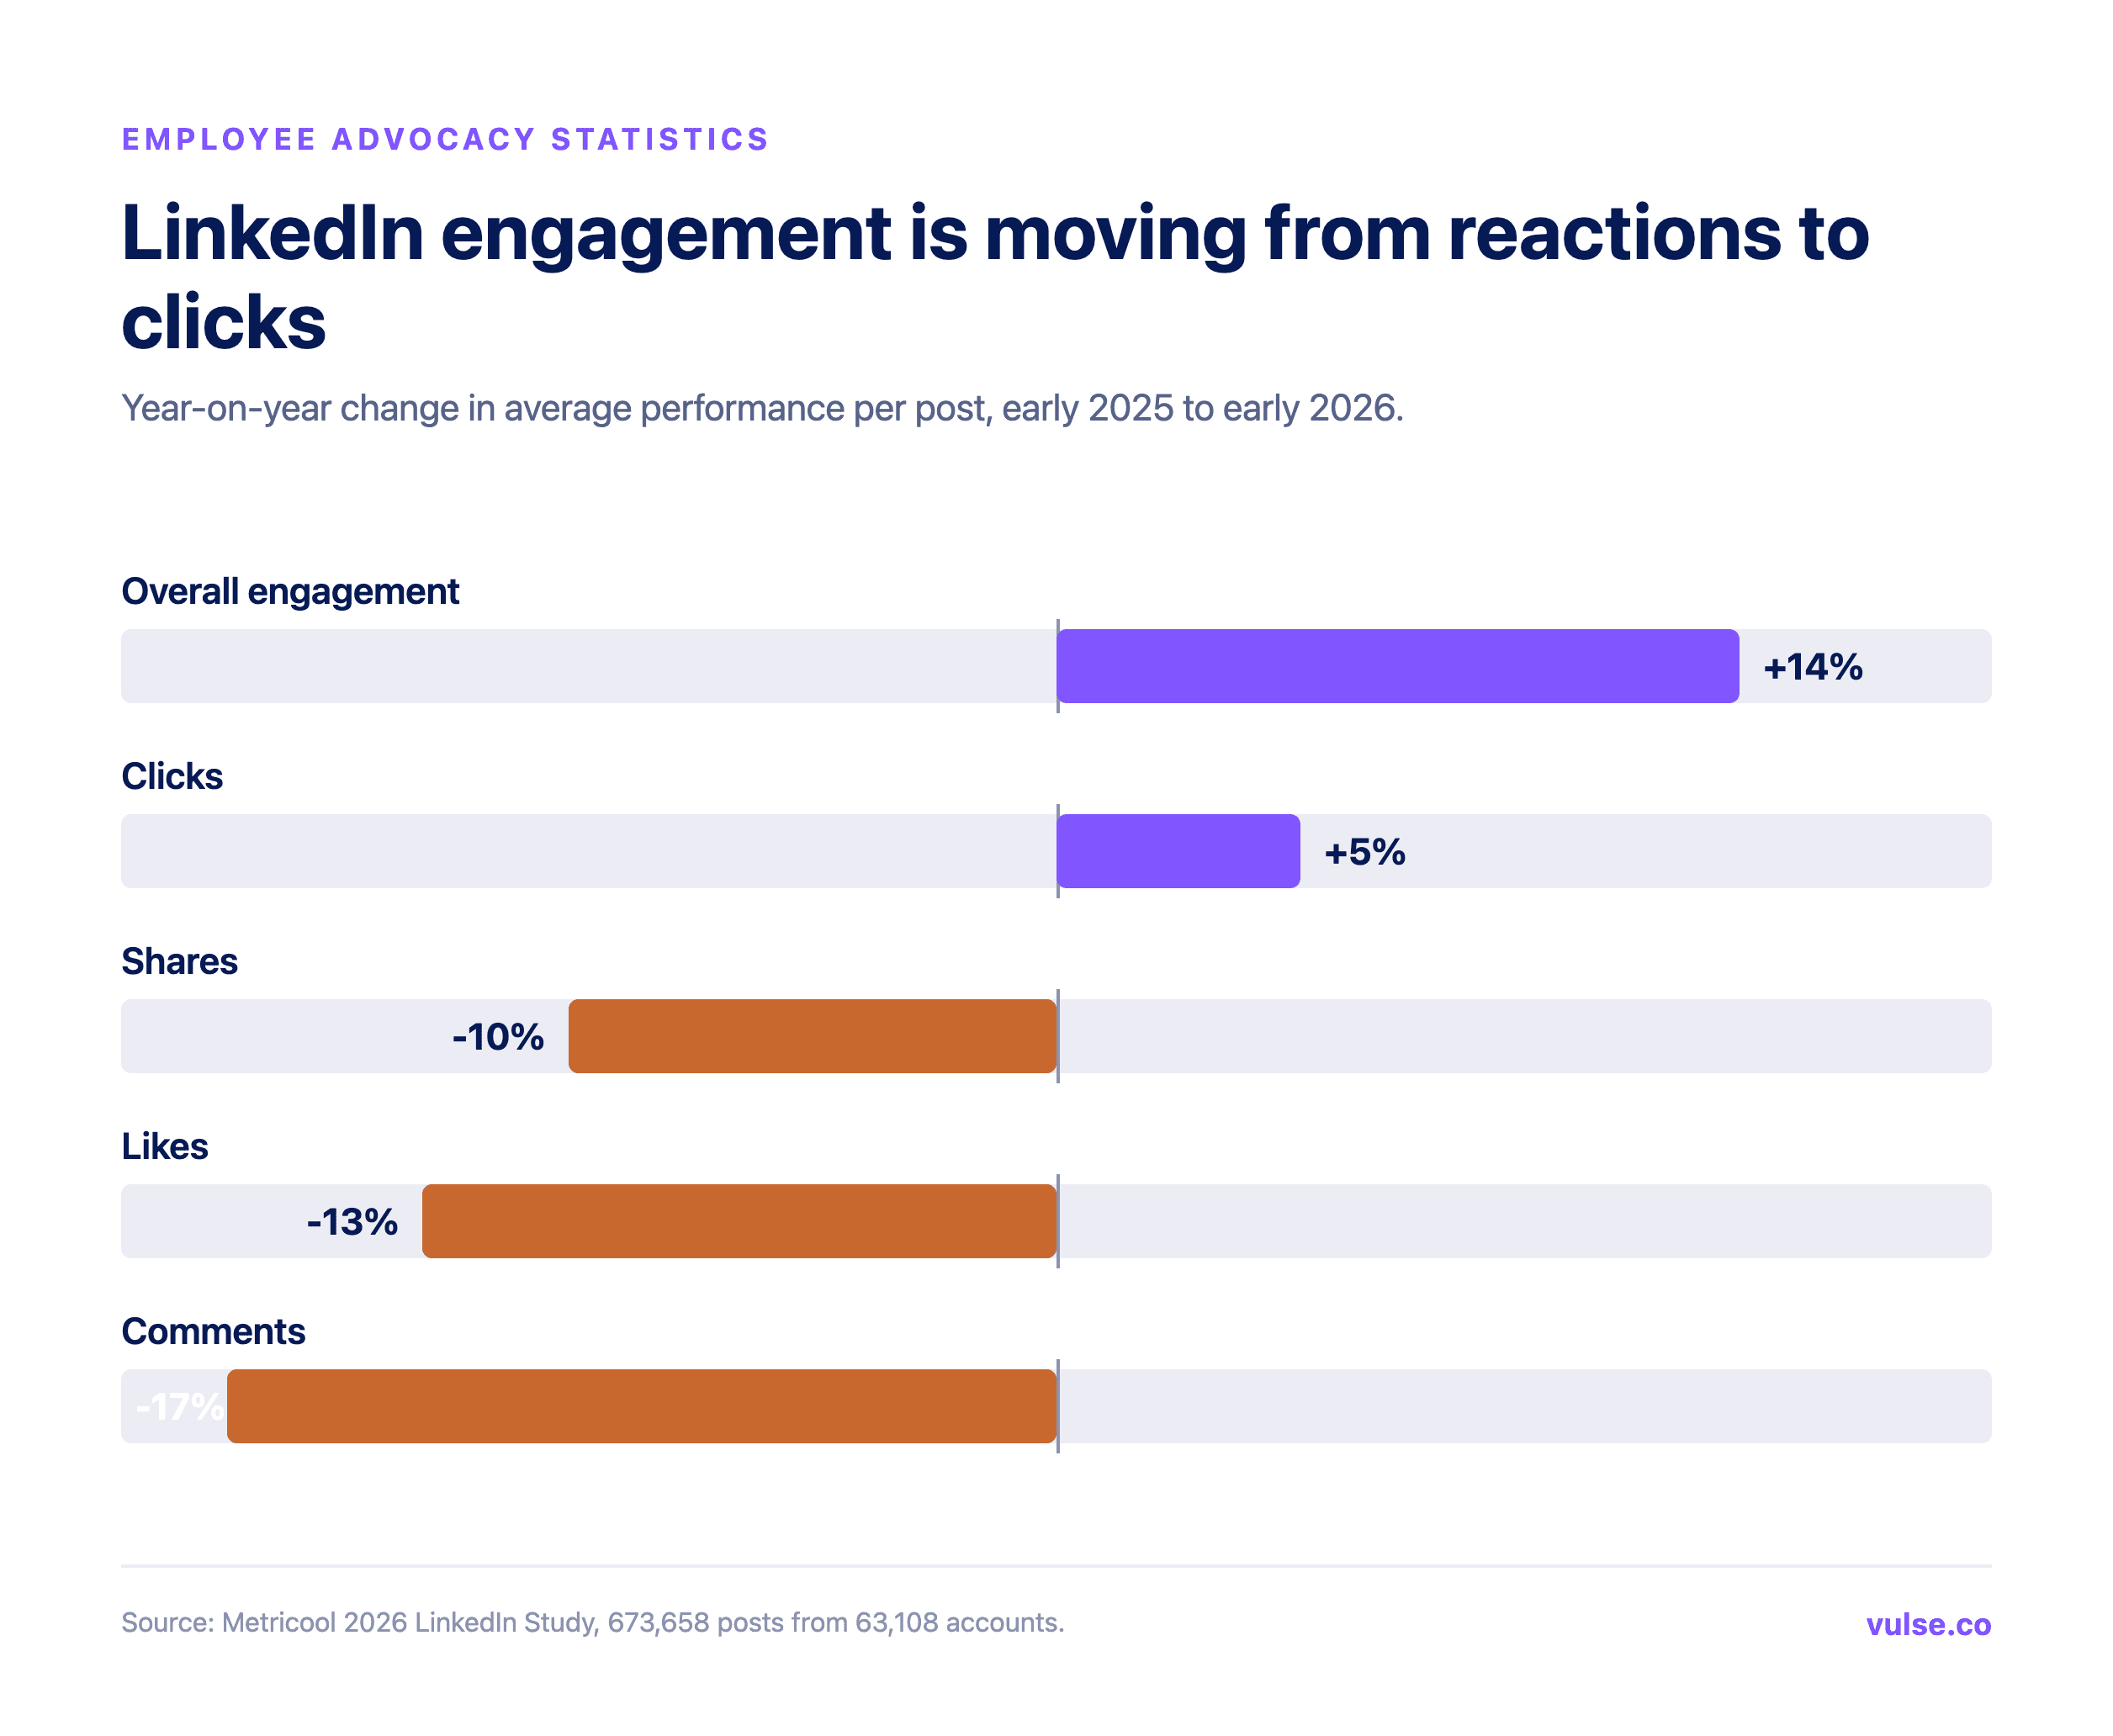
The headline pair has held for a decade now: employee-shared content earns about 8x the engagement and 2x the click-through of the same post from the brand (MSLGroup; LinkedIn). What has changed is how engagement looks. Between early 2025 and early 2026, LinkedIn likes fell 13%, comments 17% and shares 10%, while clicks rose 5% and overall engagement climbed almost 14%. People are still paying attention and simply doing it more quietly (Metricool, 2026 LinkedIn Study). And the audience is there for it: nearly 70% of LinkedIn users interact with brand content at least weekly, and 34% engage most with user-generated content (Sprout Social, 2026 Social Media Content Strategy Report). Among 1,000 consumers Sprout surveyed, 87% of millennials said they feel closer to a brand when they see its employees posting about it, and 81% think it matters that employees post about where they work, up from 72% the wave before.
Trust and Credibility Statistics
At its core, advocacy works because of trust. Edelman's 2026 Trust Barometer, which interviewed nearly 34,000 people across 28 countries between 23 October and 18 November 2025, found 78% of employees trust their employer. That makes the employer the most trusted institution, 14 points clear of business at 64% and 25 clear of government at 53%. It goes further. Between 74% and 84% of people expect employers to help rebuild trust between groups that distrust each other, and 73% expect CEOs to lead that work. The most trusted voice is the ordinary employee: people are around 3x more likely to believe information about a company when it comes from an ordinary employee (Edelman, cited in LinkedIn's Official Guide to Employee Advocacy). The consumer research points the same way: Nielsen found that 88% of people trust recommendations from people they know above every form of advertising, and McKinsey puts word of mouth behind 20% to 50% of all purchasing decisions.
Social Selling, Pipeline and Revenue Statistics
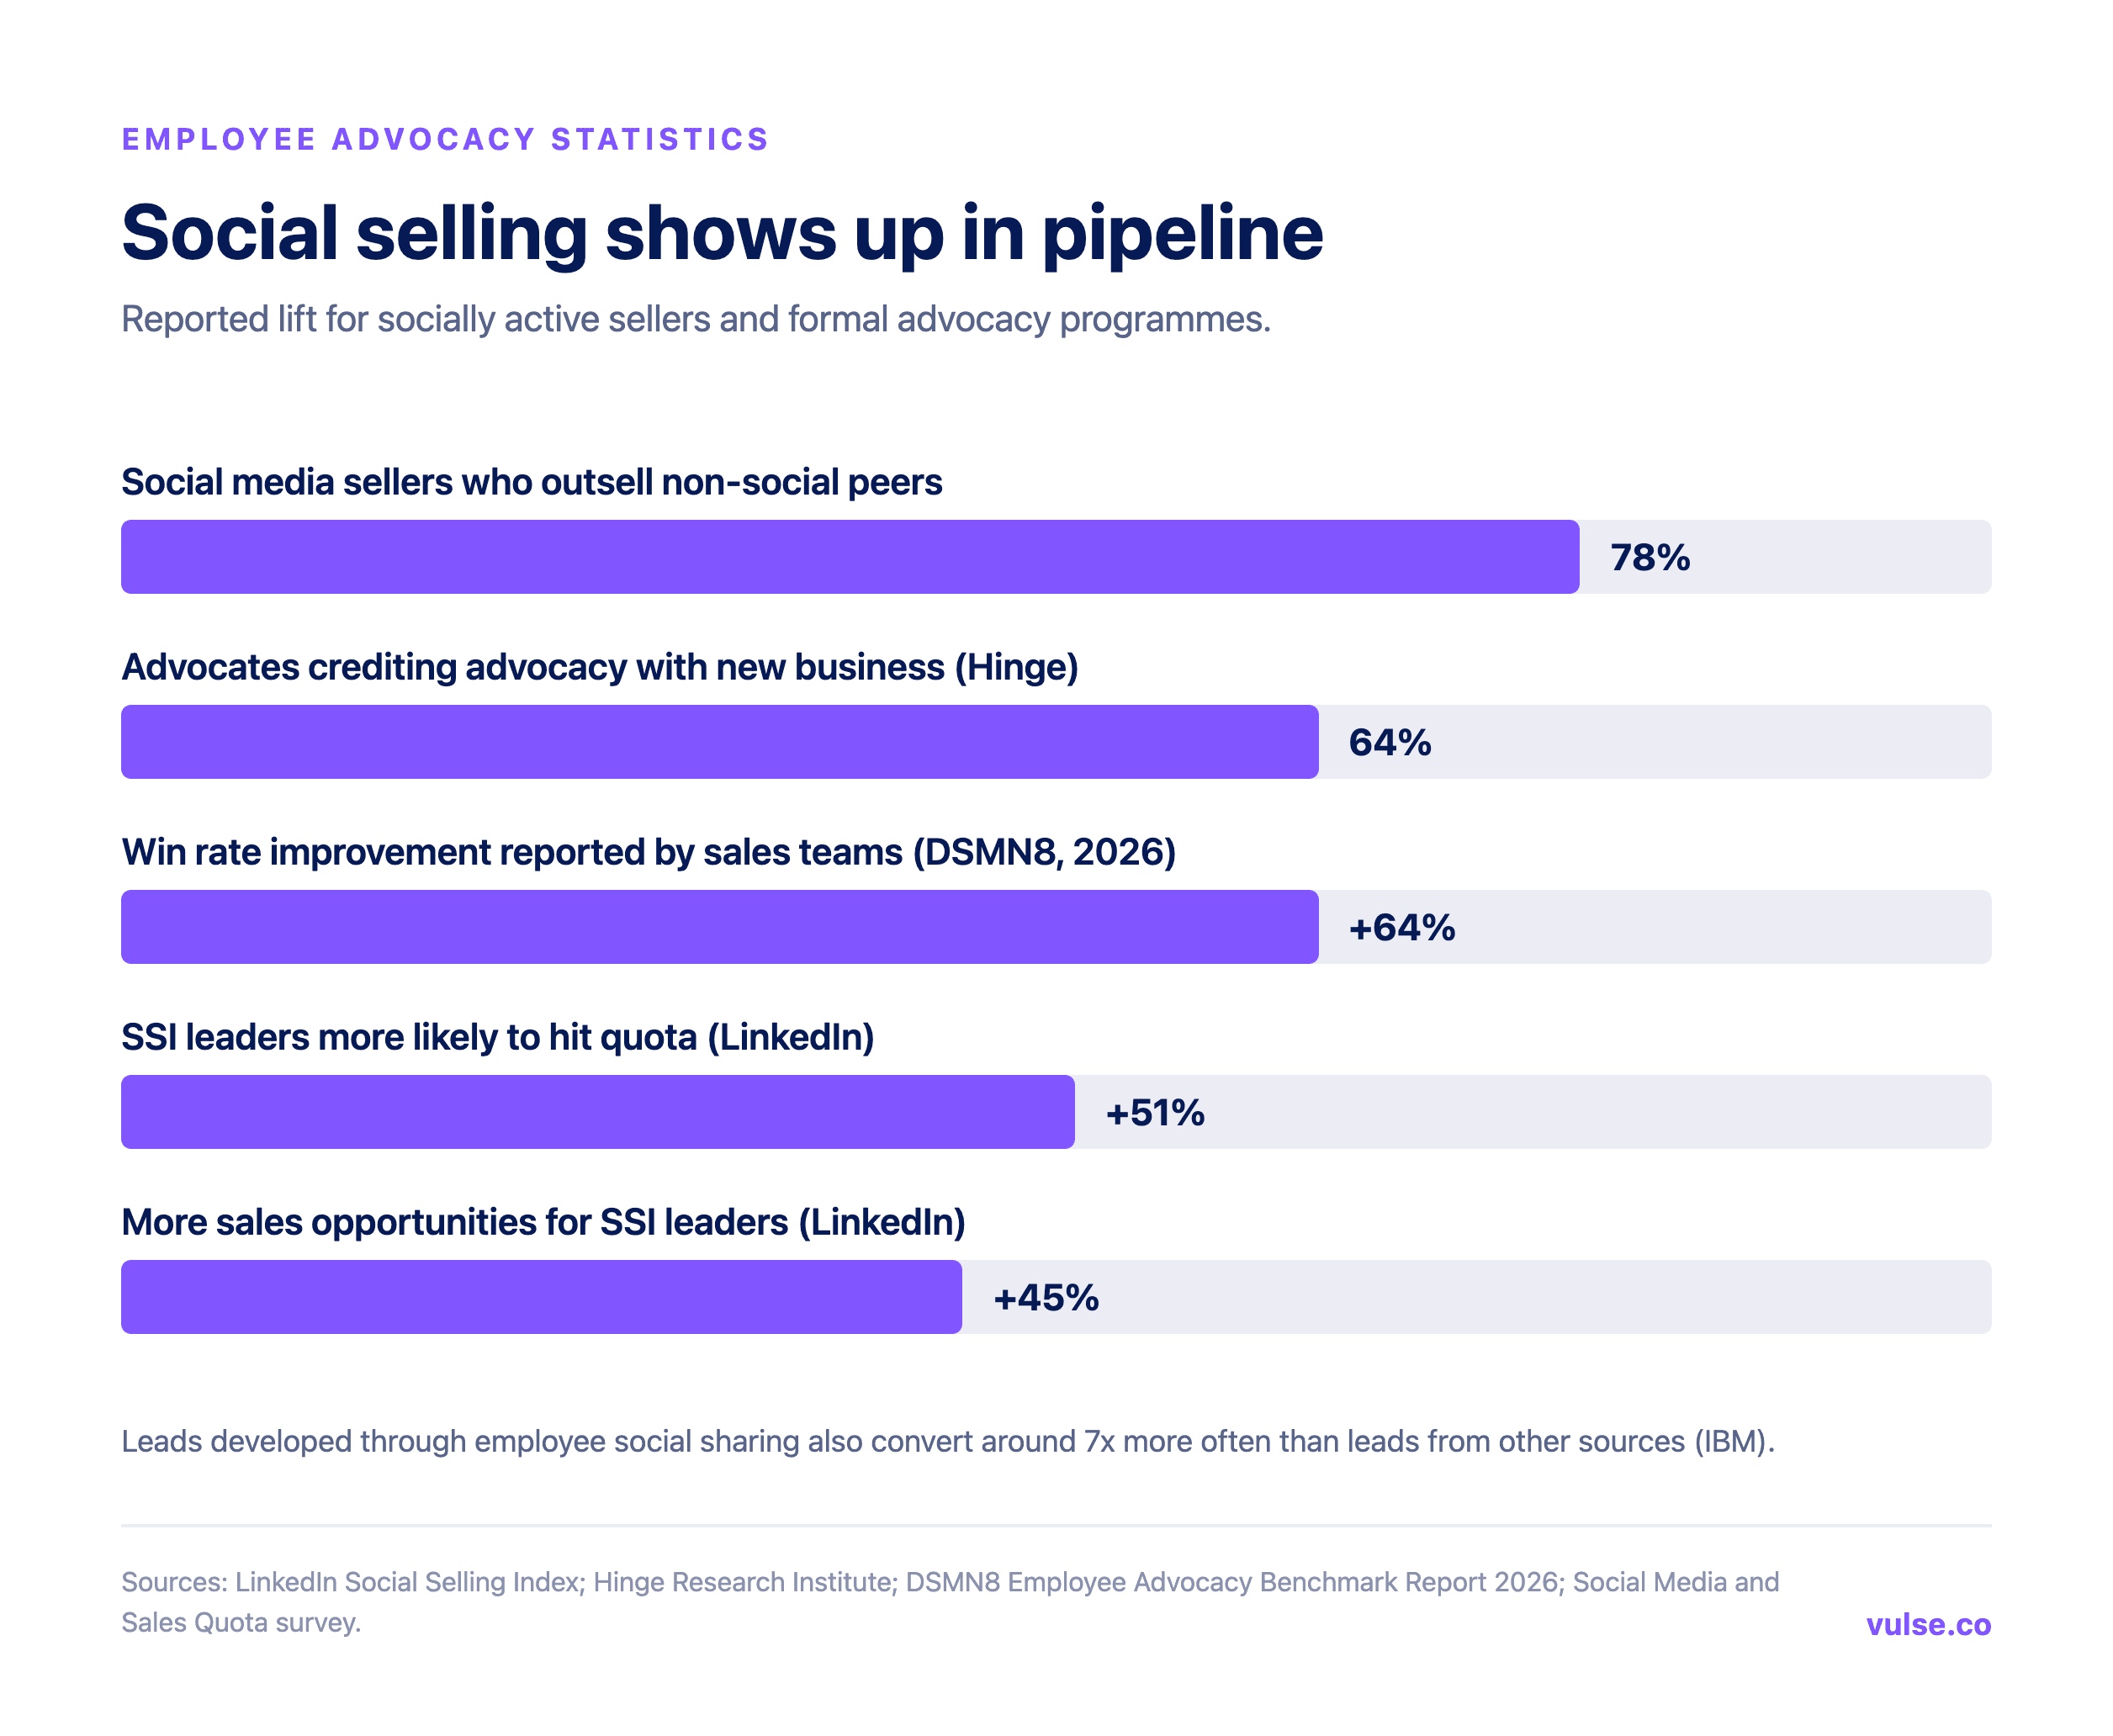
This is where advocacy stops being a marketing metric and starts being a sales one. Social selling leaders on LinkedIn create 45% more opportunities than colleagues with lower Social Selling Index scores and are 51% more likely to hit quota, while salespeople who simply share company content regularly are 45% more likely to beat target (LinkedIn). Around 78% of social sellers outsell peers who stay offline (Social Media and Sales Quota survey, reported by Forbes). The quality holds up as well. Leads developed through employee sharing convert about 7x more often than other leads (IBM), 64% of advocates in formal programmes credit advocacy with winning new business, and 45% trace new revenue streams back to it (Hinge Research Institute). Sales teams have noticed: DSMN8's 2026 benchmark found they are now the single most active advocacy group at 33% of all activity, with teams reporting win rates up 64%. The buyer side explains why: 75% of B2B buyers use social media to inform purchases and 84% of C-level executives do the same (IDC).
Recruitment and Employer Brand Statistics
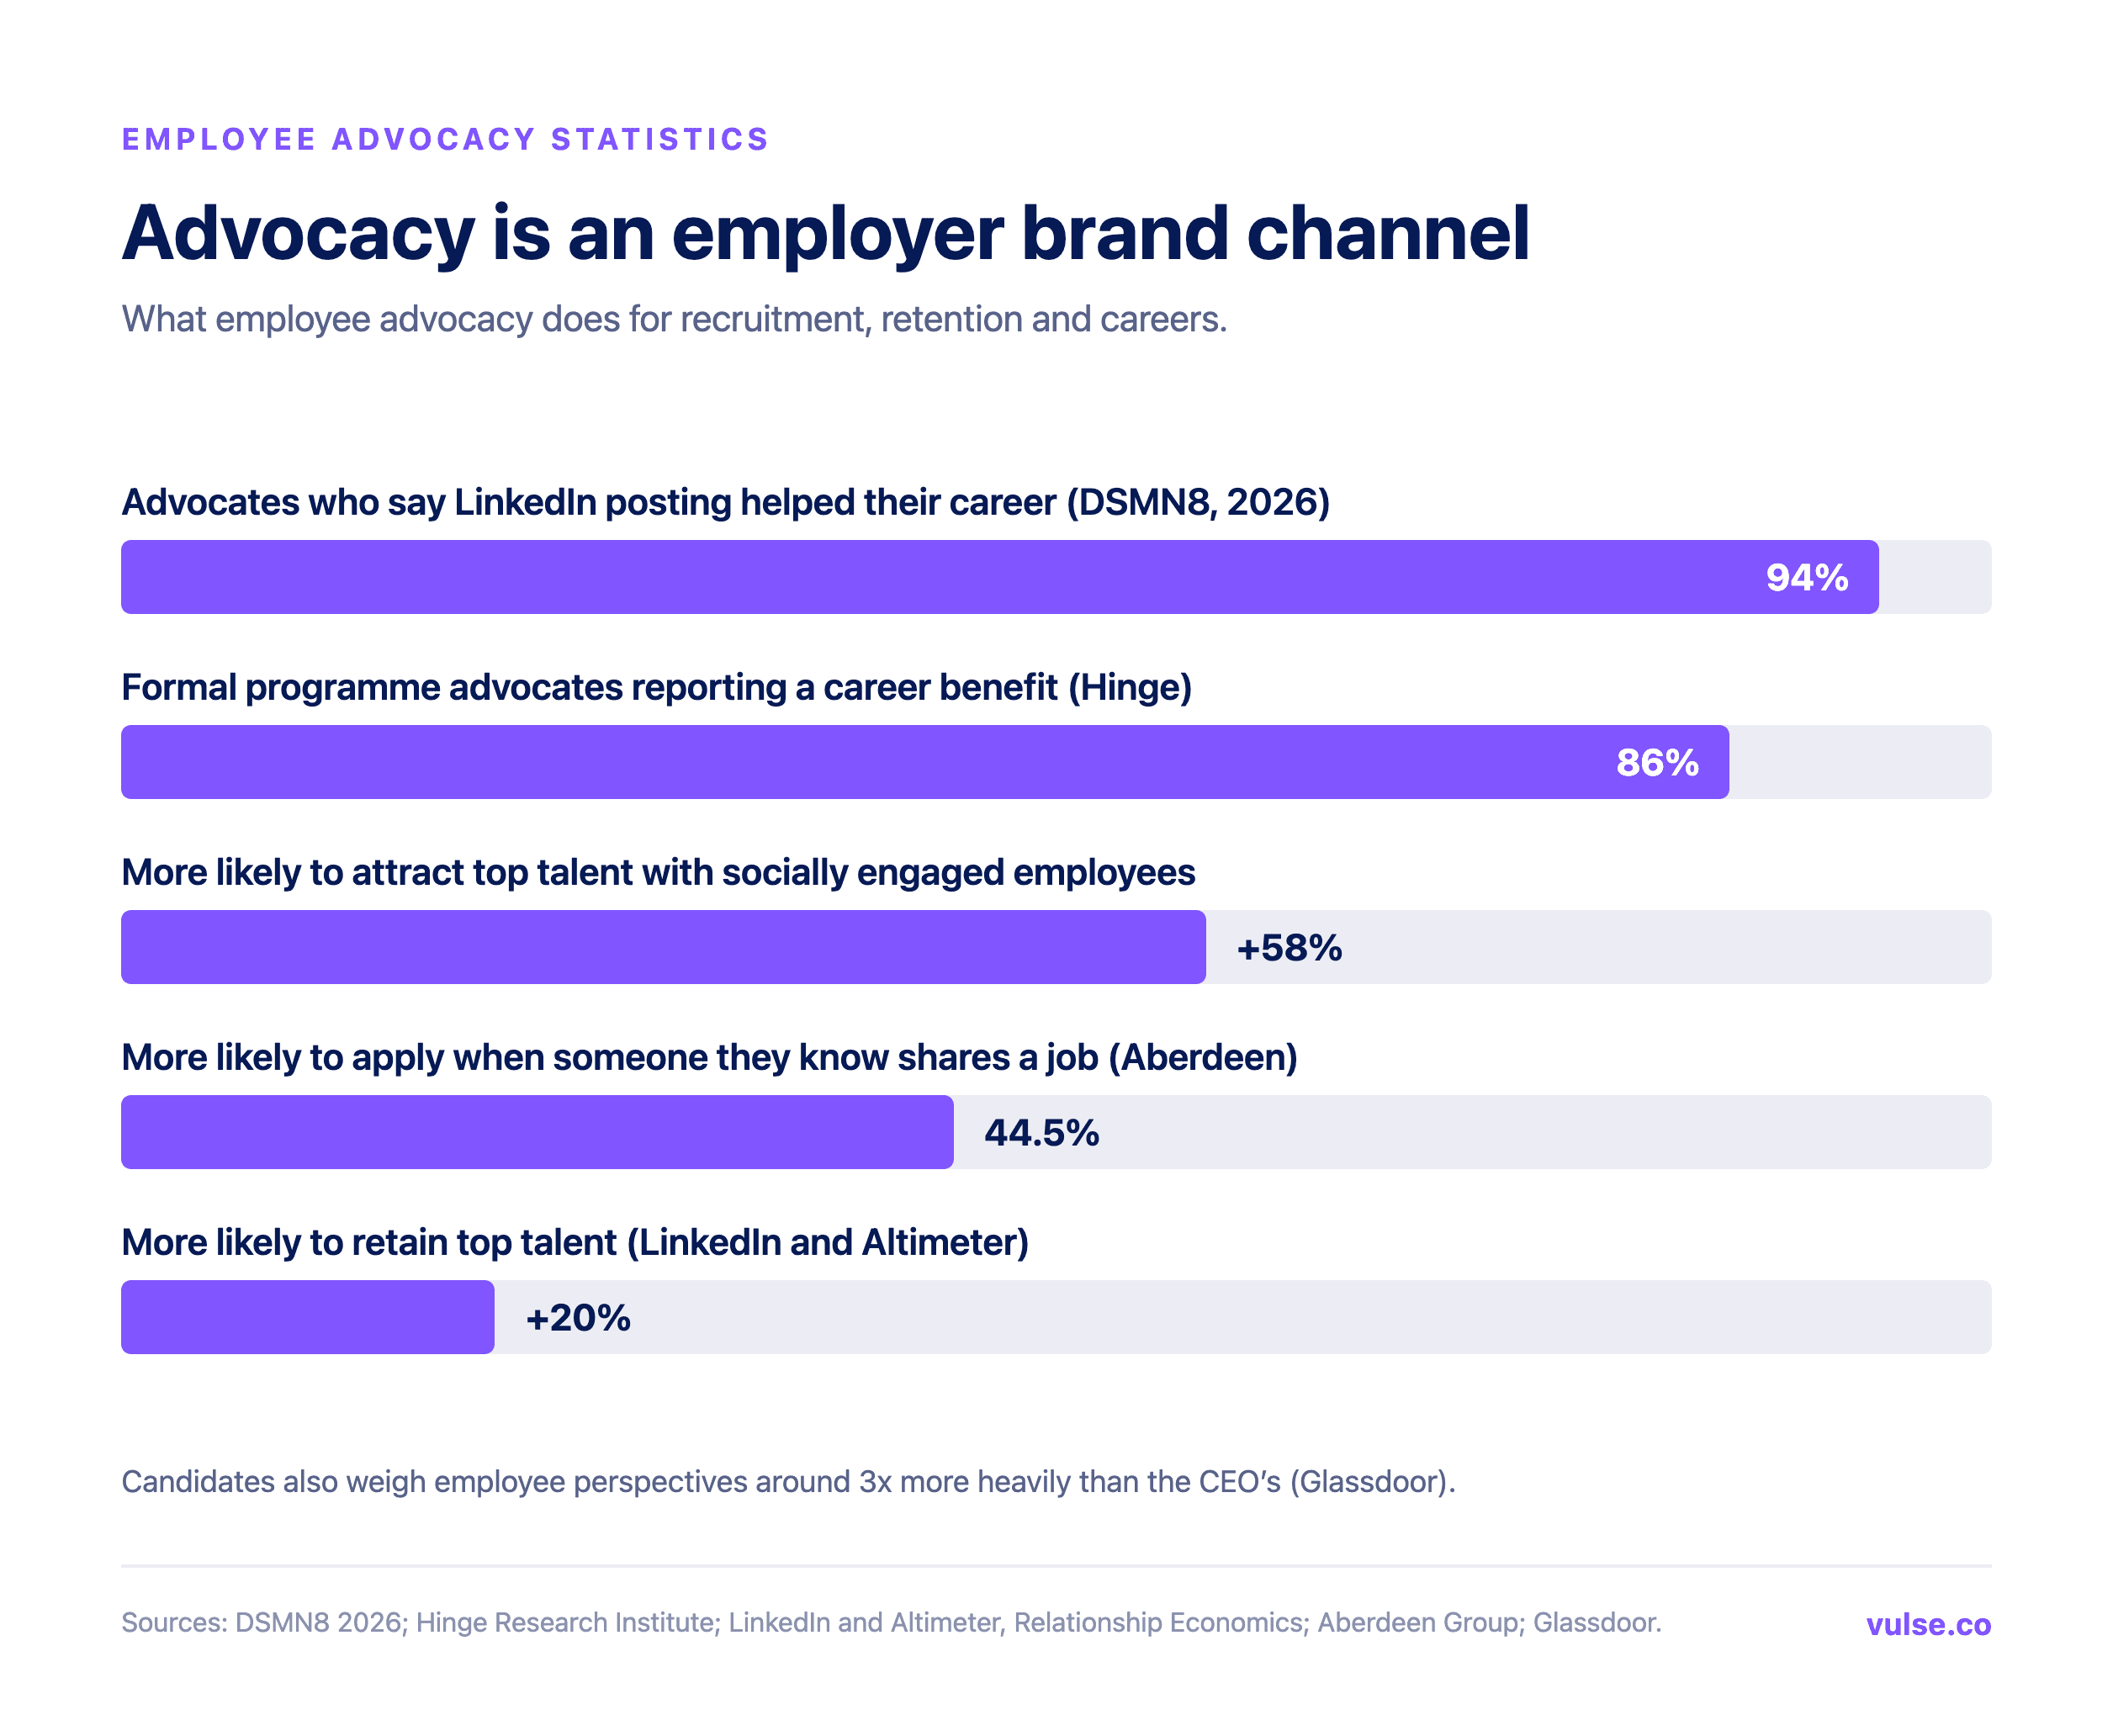
Serious candidates look up the people as well as the careers page. Companies with socially engaged employees are 58% more likely to attract top talent and 20% more likely to keep it (LinkedIn and Altimeter, Relationship Economics). Candidates trust employee voices about 3x more than the CEO's (Glassdoor), and 44.5% of people say a job shared by someone they know makes them more likely to apply (Aberdeen Group). The advocates gain too. In formal programmes, 86% say advocacy has helped their career (Hinge Research Institute), and 94% of advocates in DSMN8's 2026 study say posting on LinkedIn has been good for theirs. Inside the business, employees at socially engaged companies are 27% more likely to feel optimistic about the future and 15% more likely to feel connected to colleagues beyond their own team (LinkedIn and Altimeter). All of it plays out on a platform where 8,200 job applications land every minute (LinkedIn).
Employee Participation and Programme Ownership Statistics
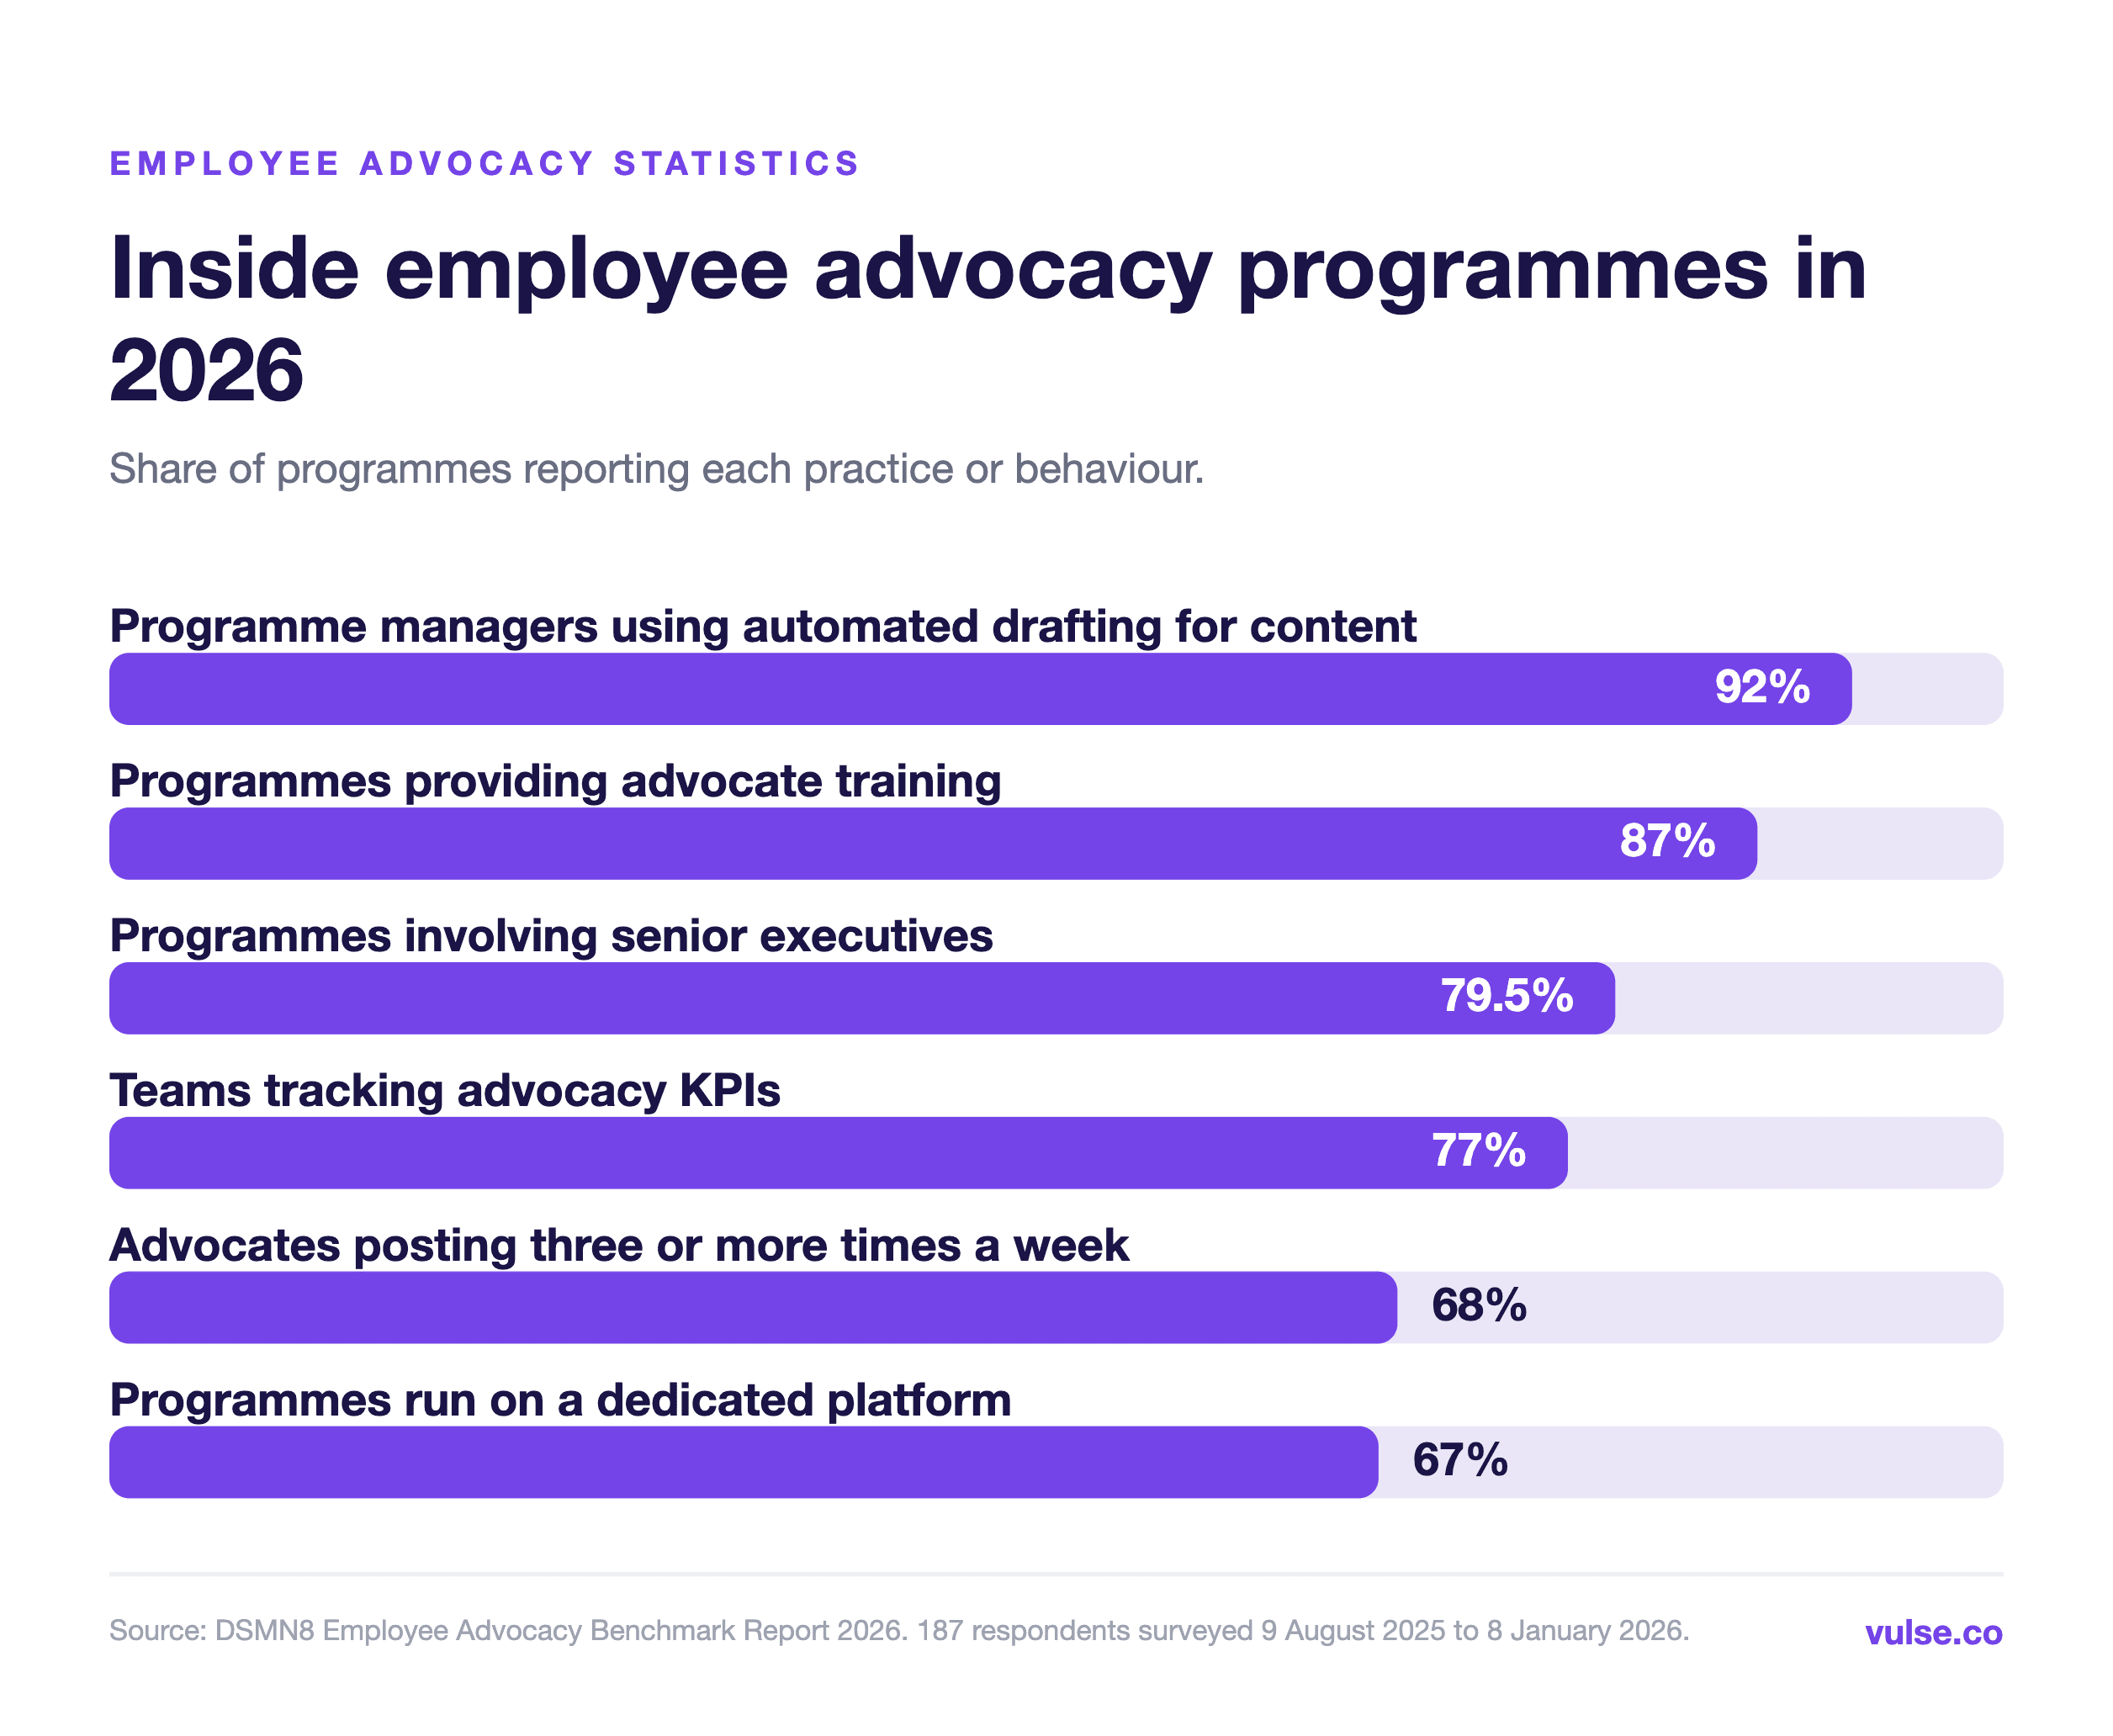
Anyone who has run a programme will say the hard part is keeping people posting in month six. The trend is encouraging. DSMN8's 2026 benchmark, drawn from 187 programme managers and advocates surveyed between 9 August 2025 and 8 January 2026, found 68% of advocates now share three or more times a week, up 13 points in a year, and 21% post more than five times. Executives are joining in too: they are involved in 79.5% of programmes and are the most active group in 7% of them, up from 5% the year before. As for who runs the show, HR owns advocacy in 39.6% of organisations, marketing in 33.9% and corporate communications in 17%. Two thirds (67%) run it on a dedicated platform while 28% still juggle it manually, and the typical programme feeds advocates four new pieces of content a week. Brand awareness leads the objectives at 81%, ahead of employee engagement at 60%, company culture at 53% and lead generation at 46%. The raw material is plentiful: about 98% of employees are on at least one social network and half already talk about work there (Weber Shandwick).
Training, Enablement and Automation Statistics
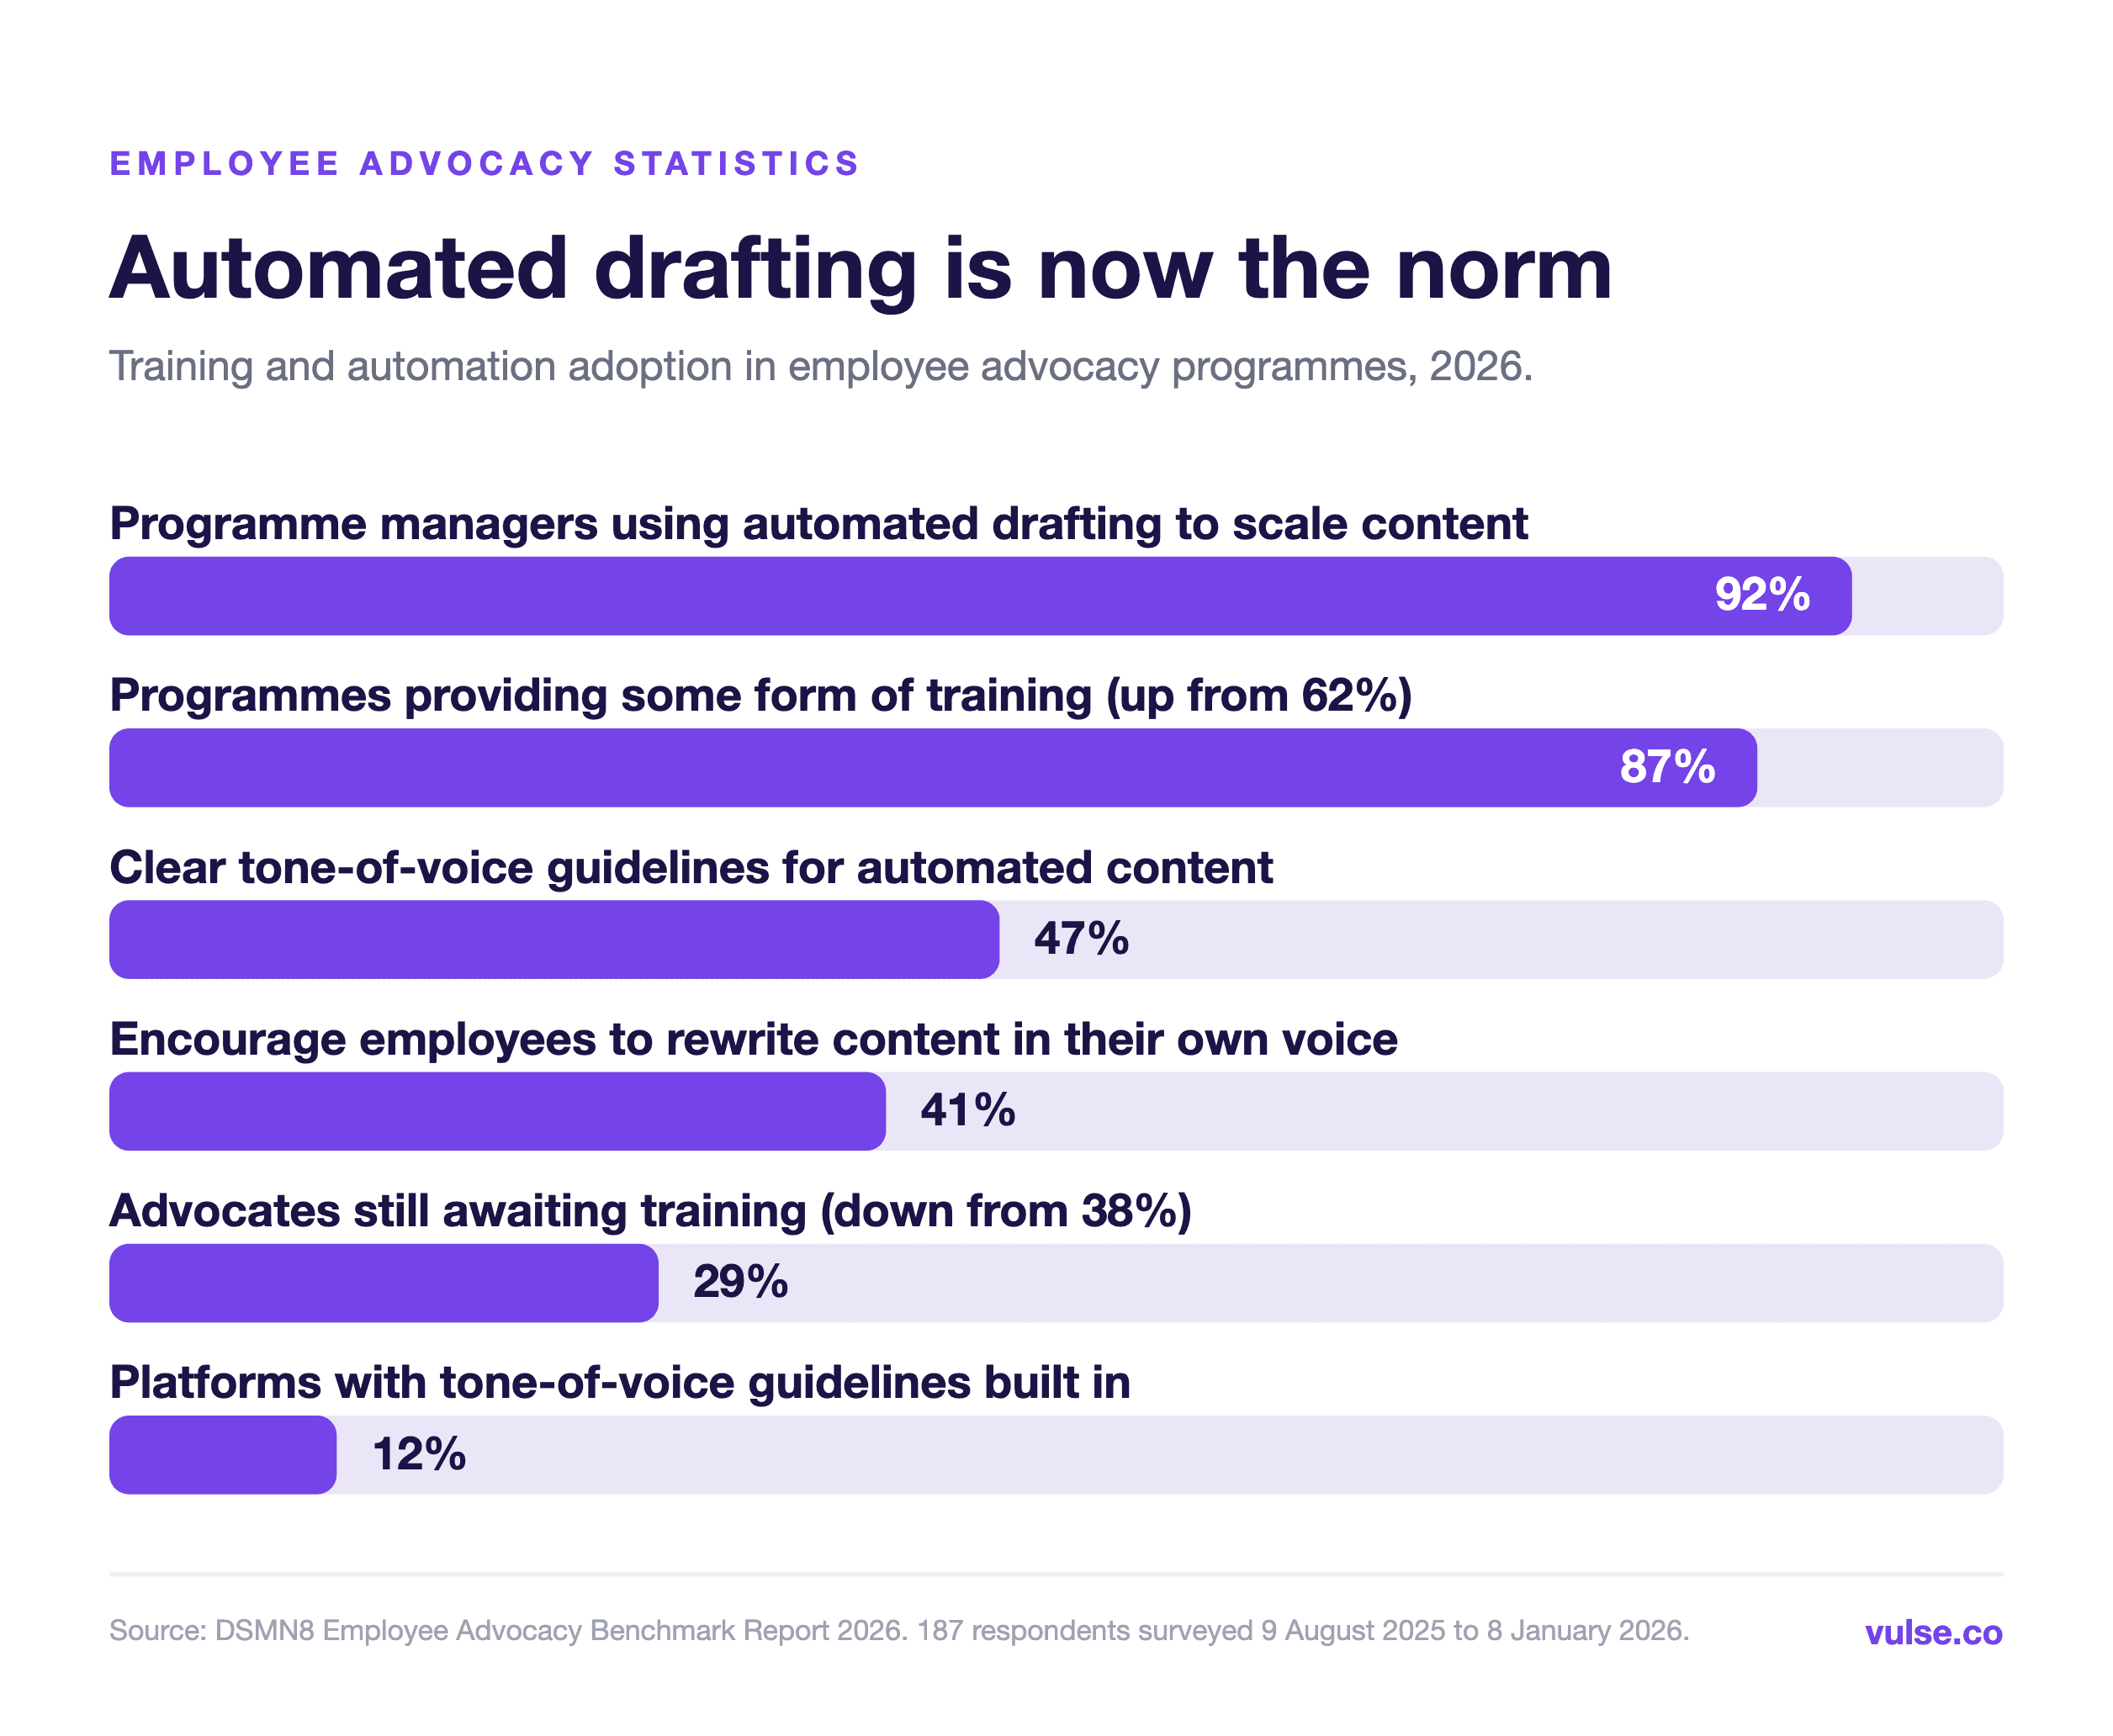
For years the industry's best-kept gap was that only a quarter of advocates had received any social media training (Hinge Research Institute). That is finally changing. In DSMN8's 2026 benchmark, 87% of programme managers now offer training, up from 62% a year earlier, and the share of advocates with none fell from 38% to 29%. Structured sessions are the most popular format at 43%, and the most common blocker is refreshingly human: 18% of advocates are unsure what to share. Automated drafting, meanwhile, has gone from experiment to default. Some 92% of programme managers use it to scale content production and another 7% are about to. Governance is still catching up: 47% have clear tone-of-voice guidelines for automated content, 41% actively encourage employees to rewrite drafts in their own words, and 12% use a platform with tone-of-voice guardrails built in. That gap matters, because Sprout Social found 72% of engaged employees would happily post about their company if someone wrote the content for them.
Measurement, Cost Efficiency and ROI Statistics
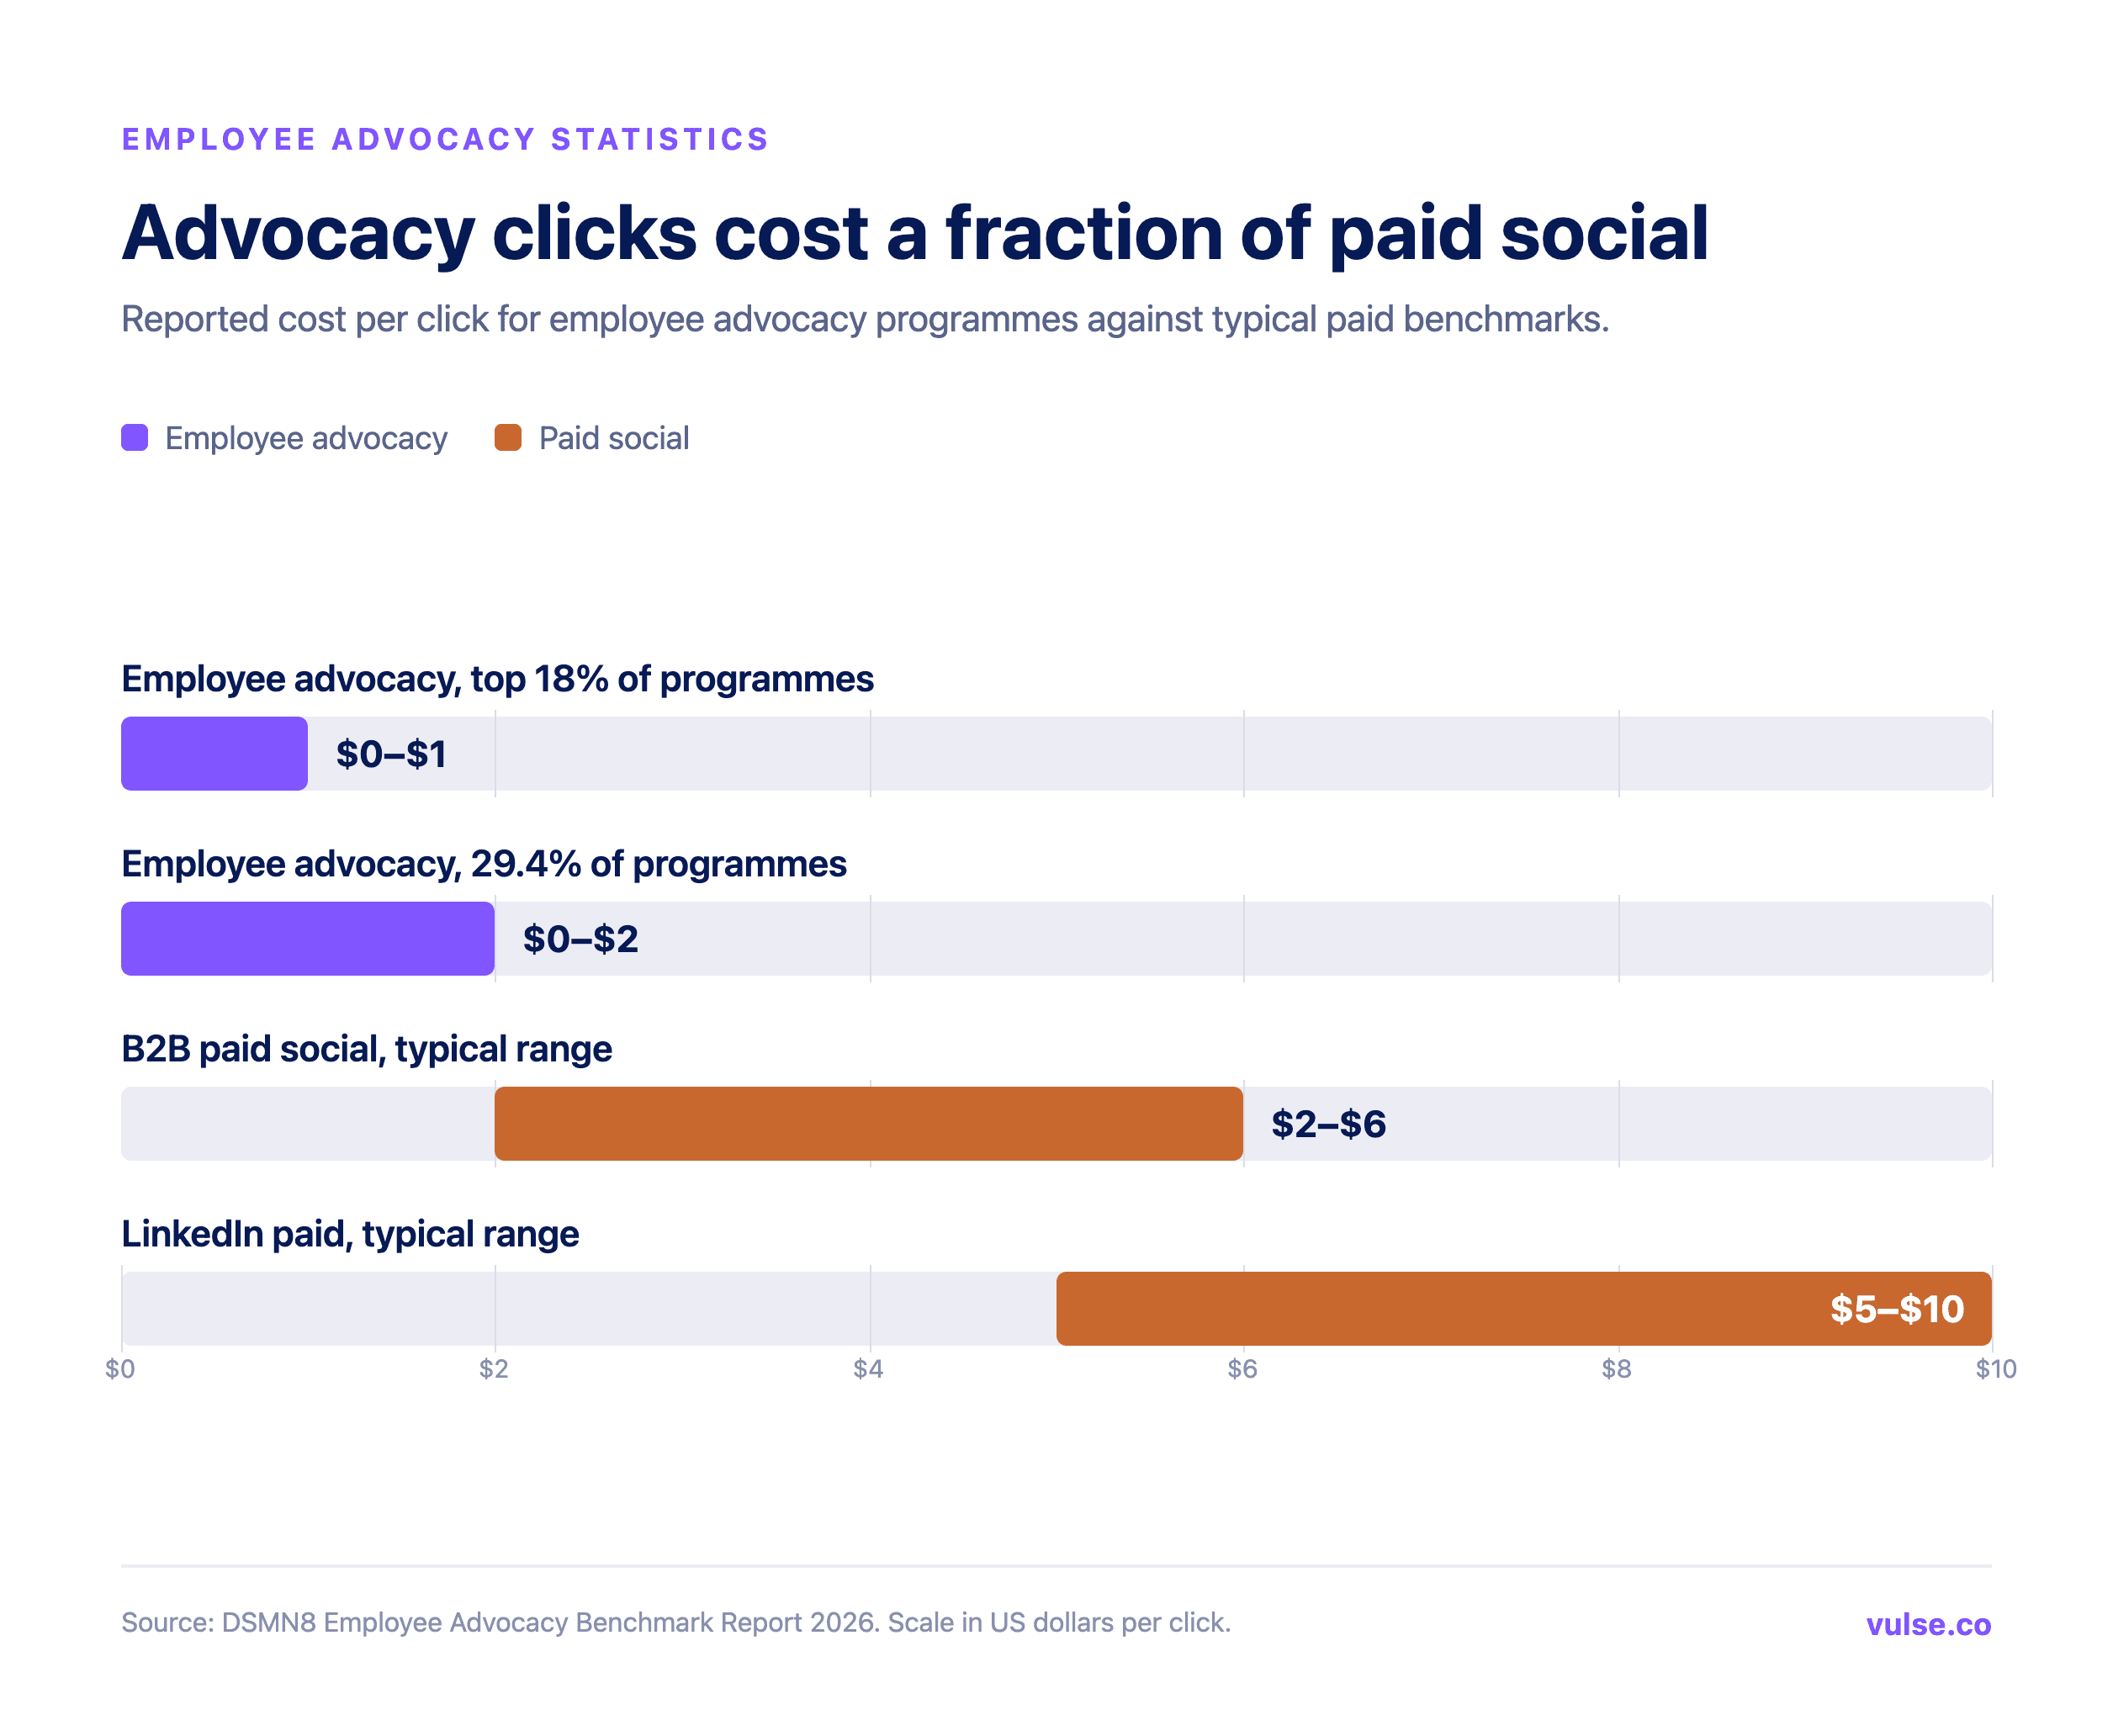
Advocacy measurement has grown up: 77% of teams now track KPIs. Benchmarking is the laggard, with only 44% comparing results against peers (DSMN8, 2026). The favourite yardsticks are earned media value or cost per click (67%), follower growth (43%), website traffic and conversions (43%), engagement (36%), brand awareness (36%) and employee feedback (31%). The efficiency numbers are the ones to show your CFO. In DSMN8's 2026 data, 18% of programmes get clicks for under $1 and 29.4% for under $2, while typical paid clicks run $5 to $10 on LinkedIn and $2 to $6 across B2B channels. Even LinkedIn's own cost per lead comes in about 28% below Google Ads (LinkedIn). And the outcomes follow: 79% of firms saw more online visibility after formalising a programme and 65% saw stronger brand recognition (Hinge Research Institute). Perhaps that is why 59% of programme managers now call advocacy extremely or very important to their organisation (DSMN8, 2026).
LinkedIn Benchmarks Behind Employee Advocacy
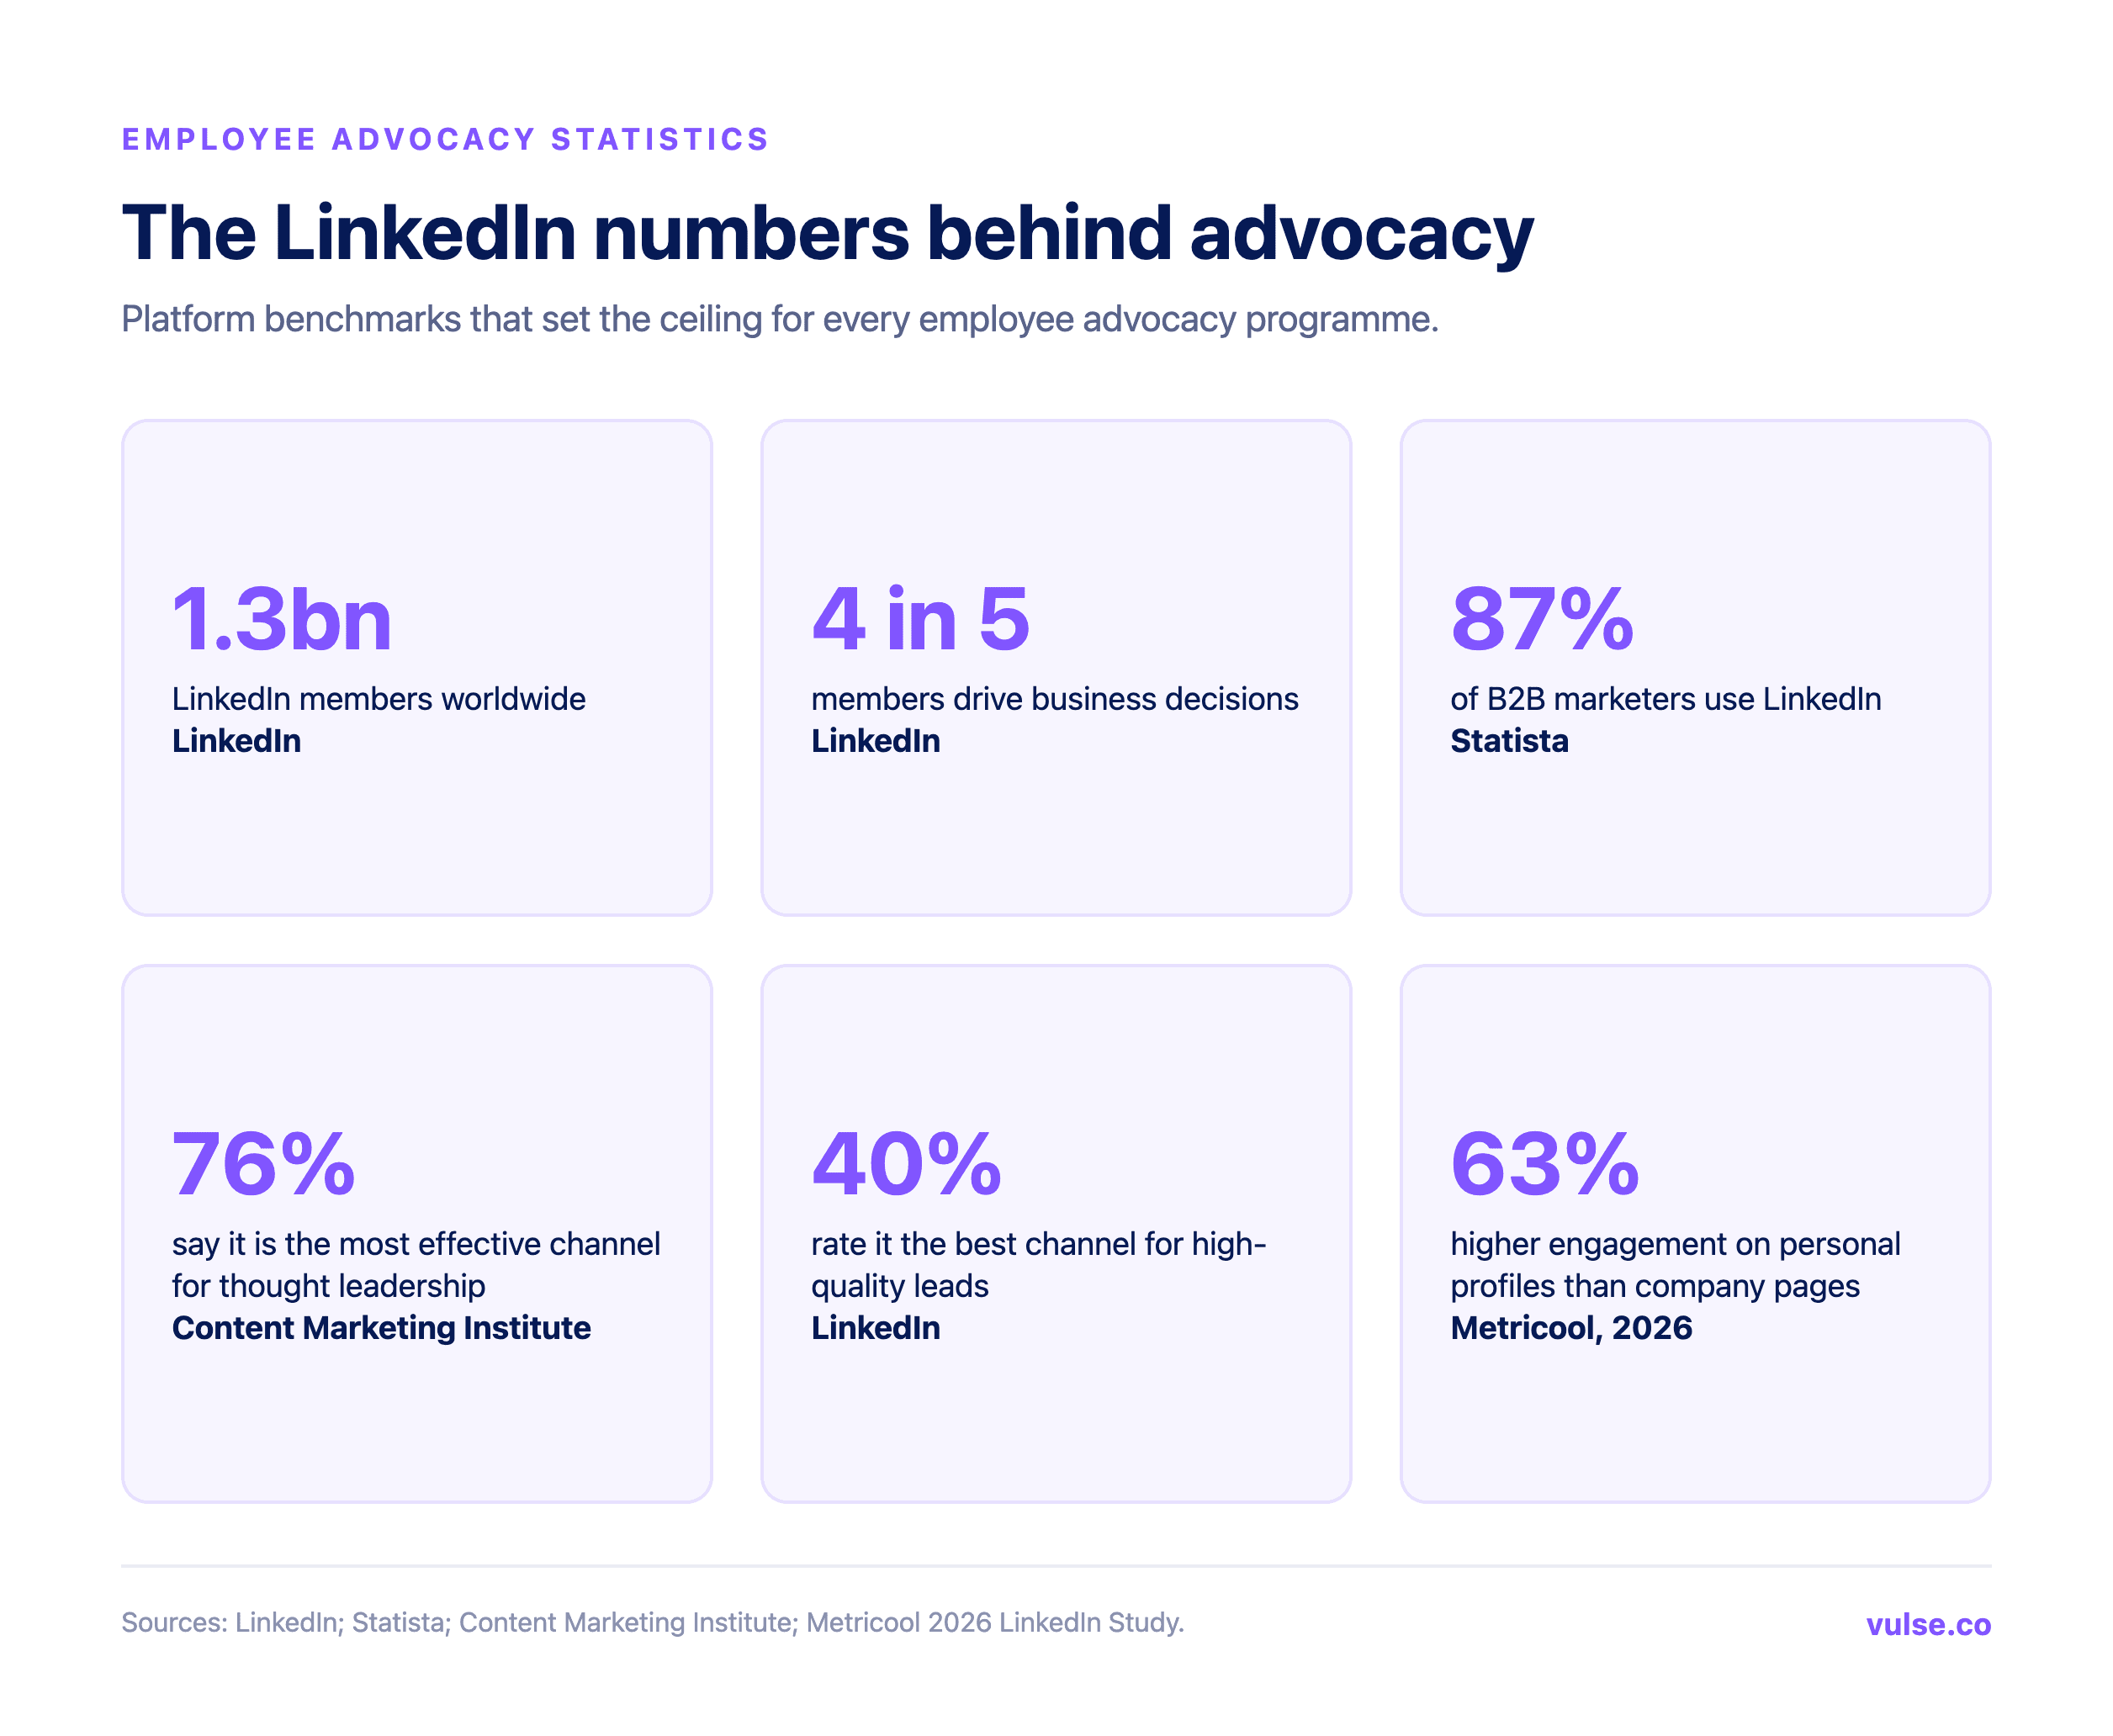
Employee advocacy lives or dies on LinkedIn, so it pays to know the platform's own numbers. LinkedIn reports 1.3 billion members, with more than 252 million in the US, 407 million across EMEA and 385 million in APAC, and says four in five members influence business decisions. Marketers have voted with their budgets: 87% of B2B marketers use the platform and 53% rank it their most important social channel (Statista), while 76% call it the most effective home for thought leadership (Content Marketing Institute). On demand generation, 40% of B2B marketers rate LinkedIn the best channel for high-quality leads, 89% use it for lead generation and 62% say it delivers (LinkedIn). And this is the pattern that justifies the whole page: complete company pages earn 30% more weekly views (LinkedIn), yet personal profiles still out-engage company pages by about 63% (Metricool, 2026). Advocacy exists to close exactly that gap.
Employee Advocacy Market Size and Growth Statistics
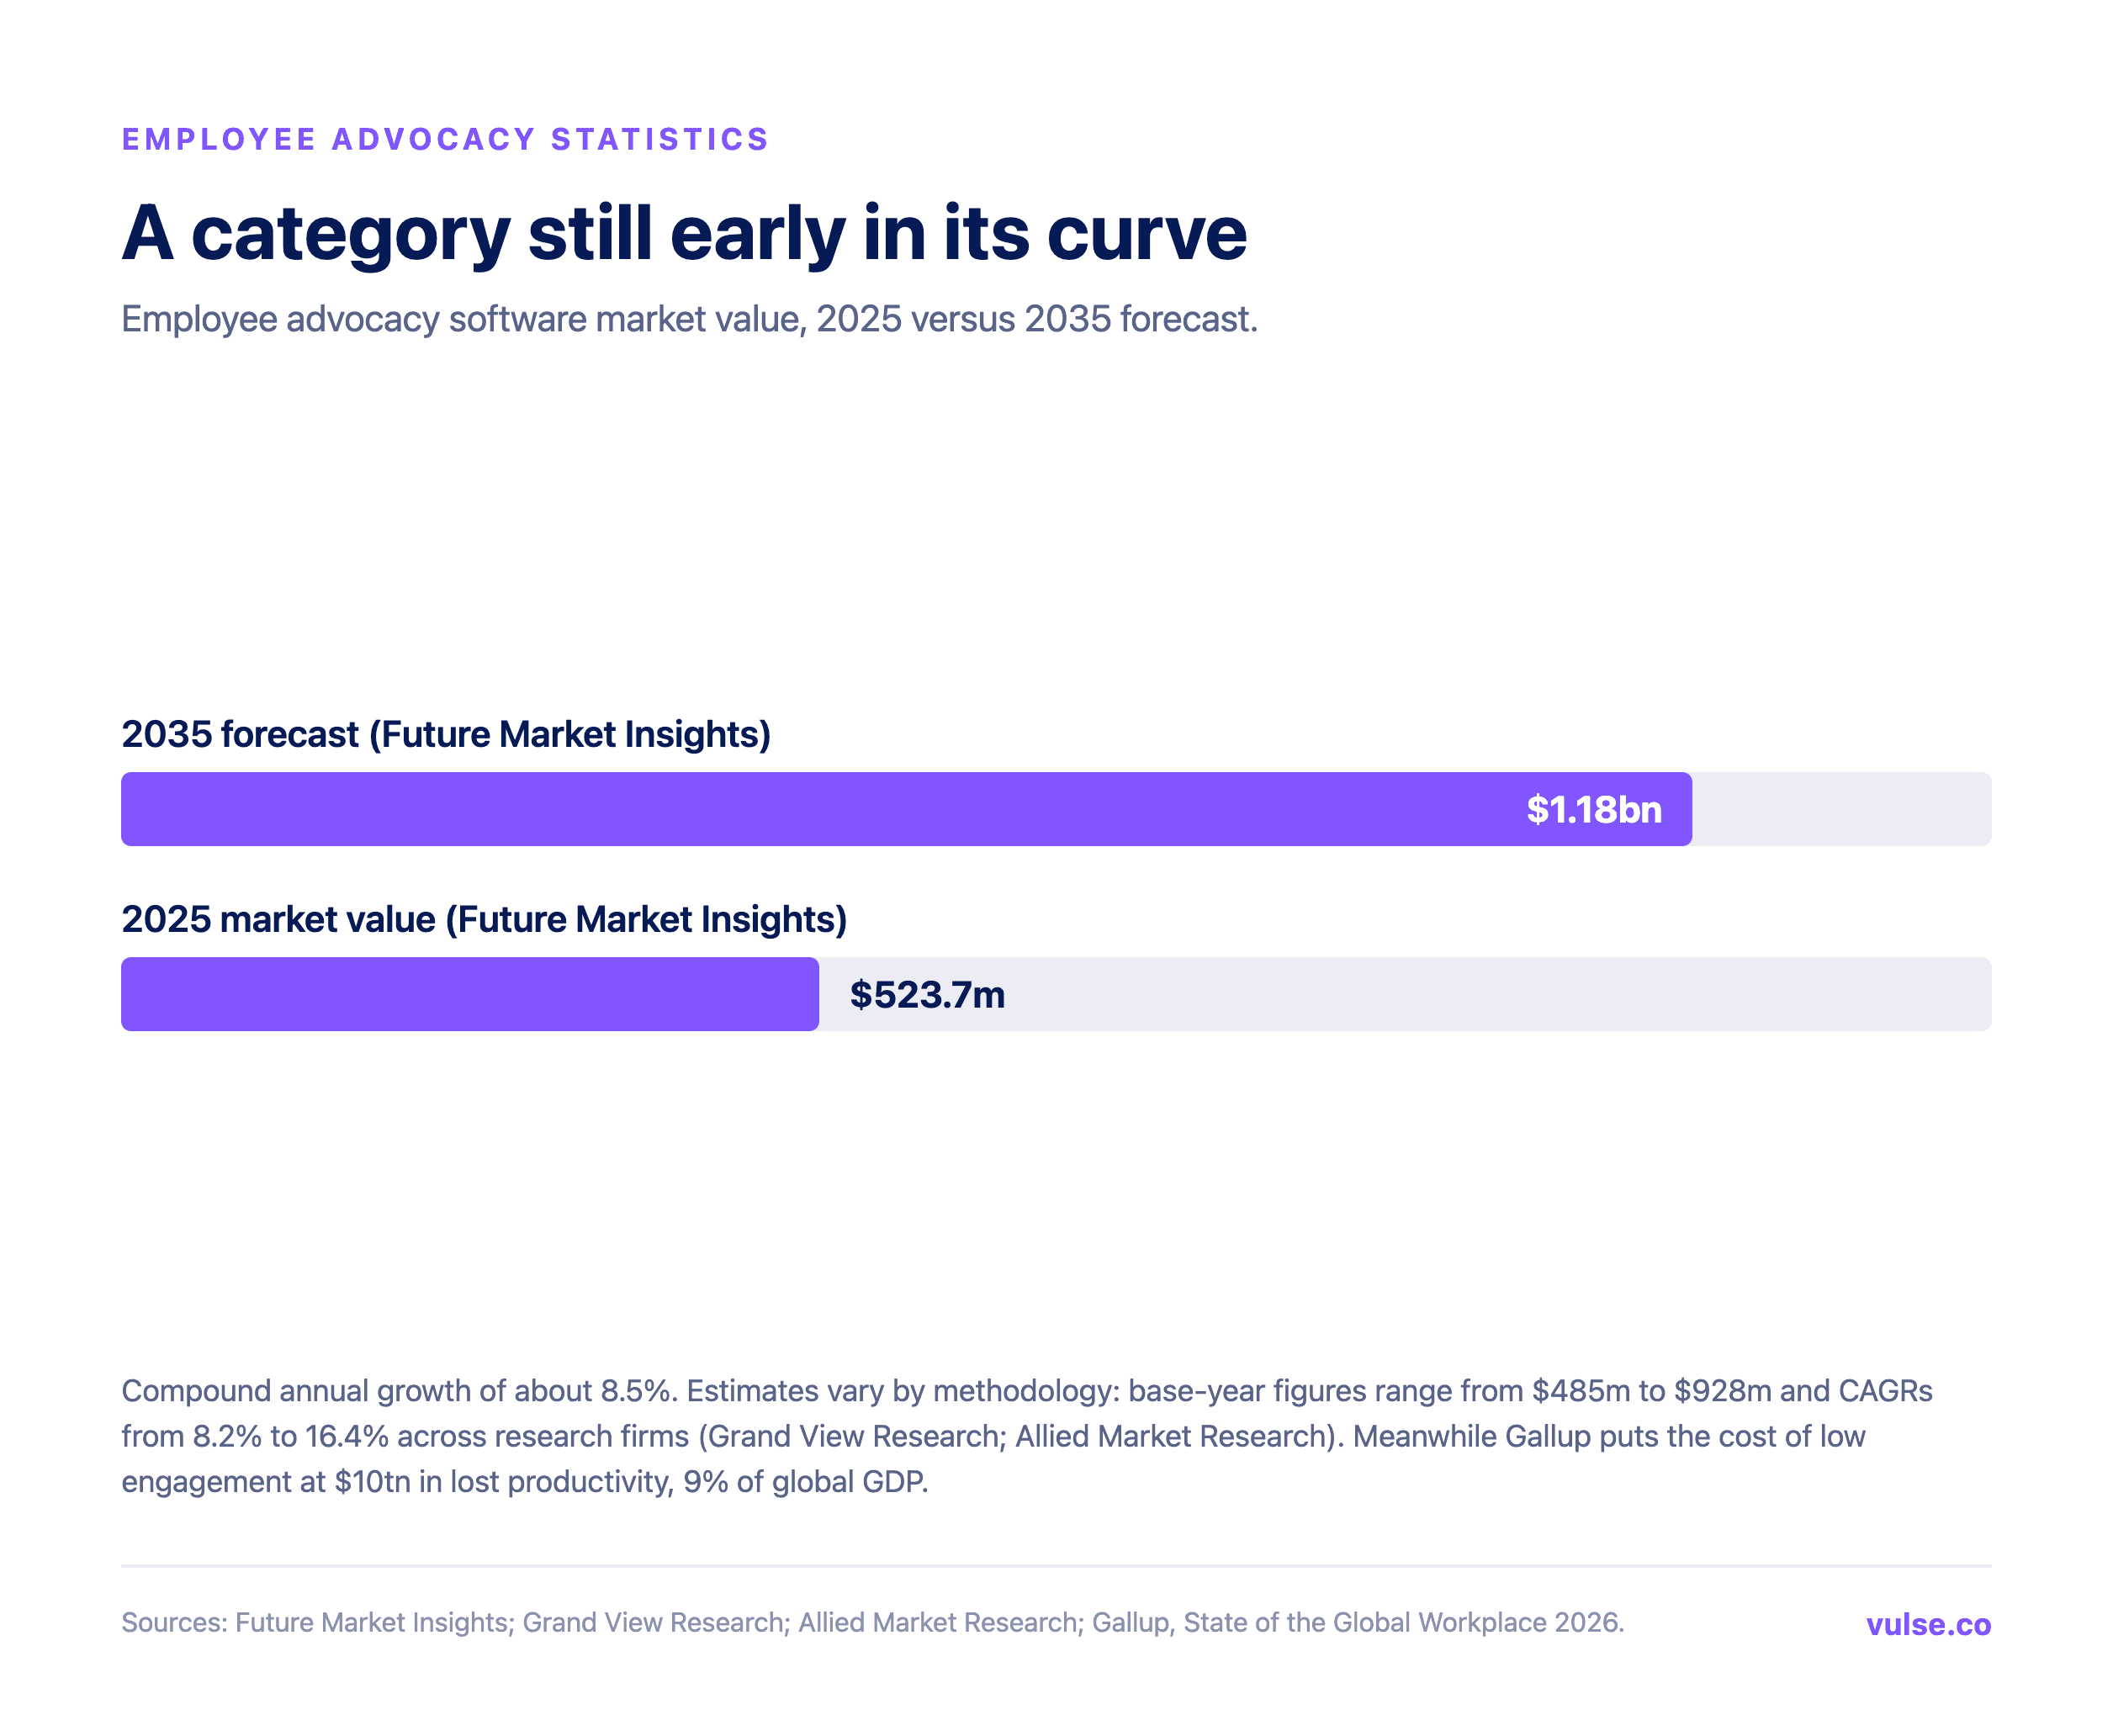
The software category is still young relative to the budgets it touches. Future Market Insights values the employee advocacy software market at about $523.7 million in 2025, heading for roughly $1.18 billion by 2035 at a compound annual growth rate of around 8.5%. Take the precision with a pinch of salt, though: base-year estimates across research firms run anywhere from $485 million to $928 million, with forecast CAGRs from 8.2% to 16.4% (Grand View Research; Allied Market Research). The backdrop explains the appetite. Gallup's 2026 State of the Global Workplace found just 20% of employees worldwide were engaged in 2025, down from 21%, with low engagement costing an estimated $10 trillion in lost productivity, about 9% of global GDP. Manager engagement slid from 27% to 22%, while thriving wellbeing crept up to 34%. Against that picture, advocacy stands out as one of the few workplace programmes that invites employees to take part rather than simply measuring them.
How to Use These Statistics, and Where They Come From
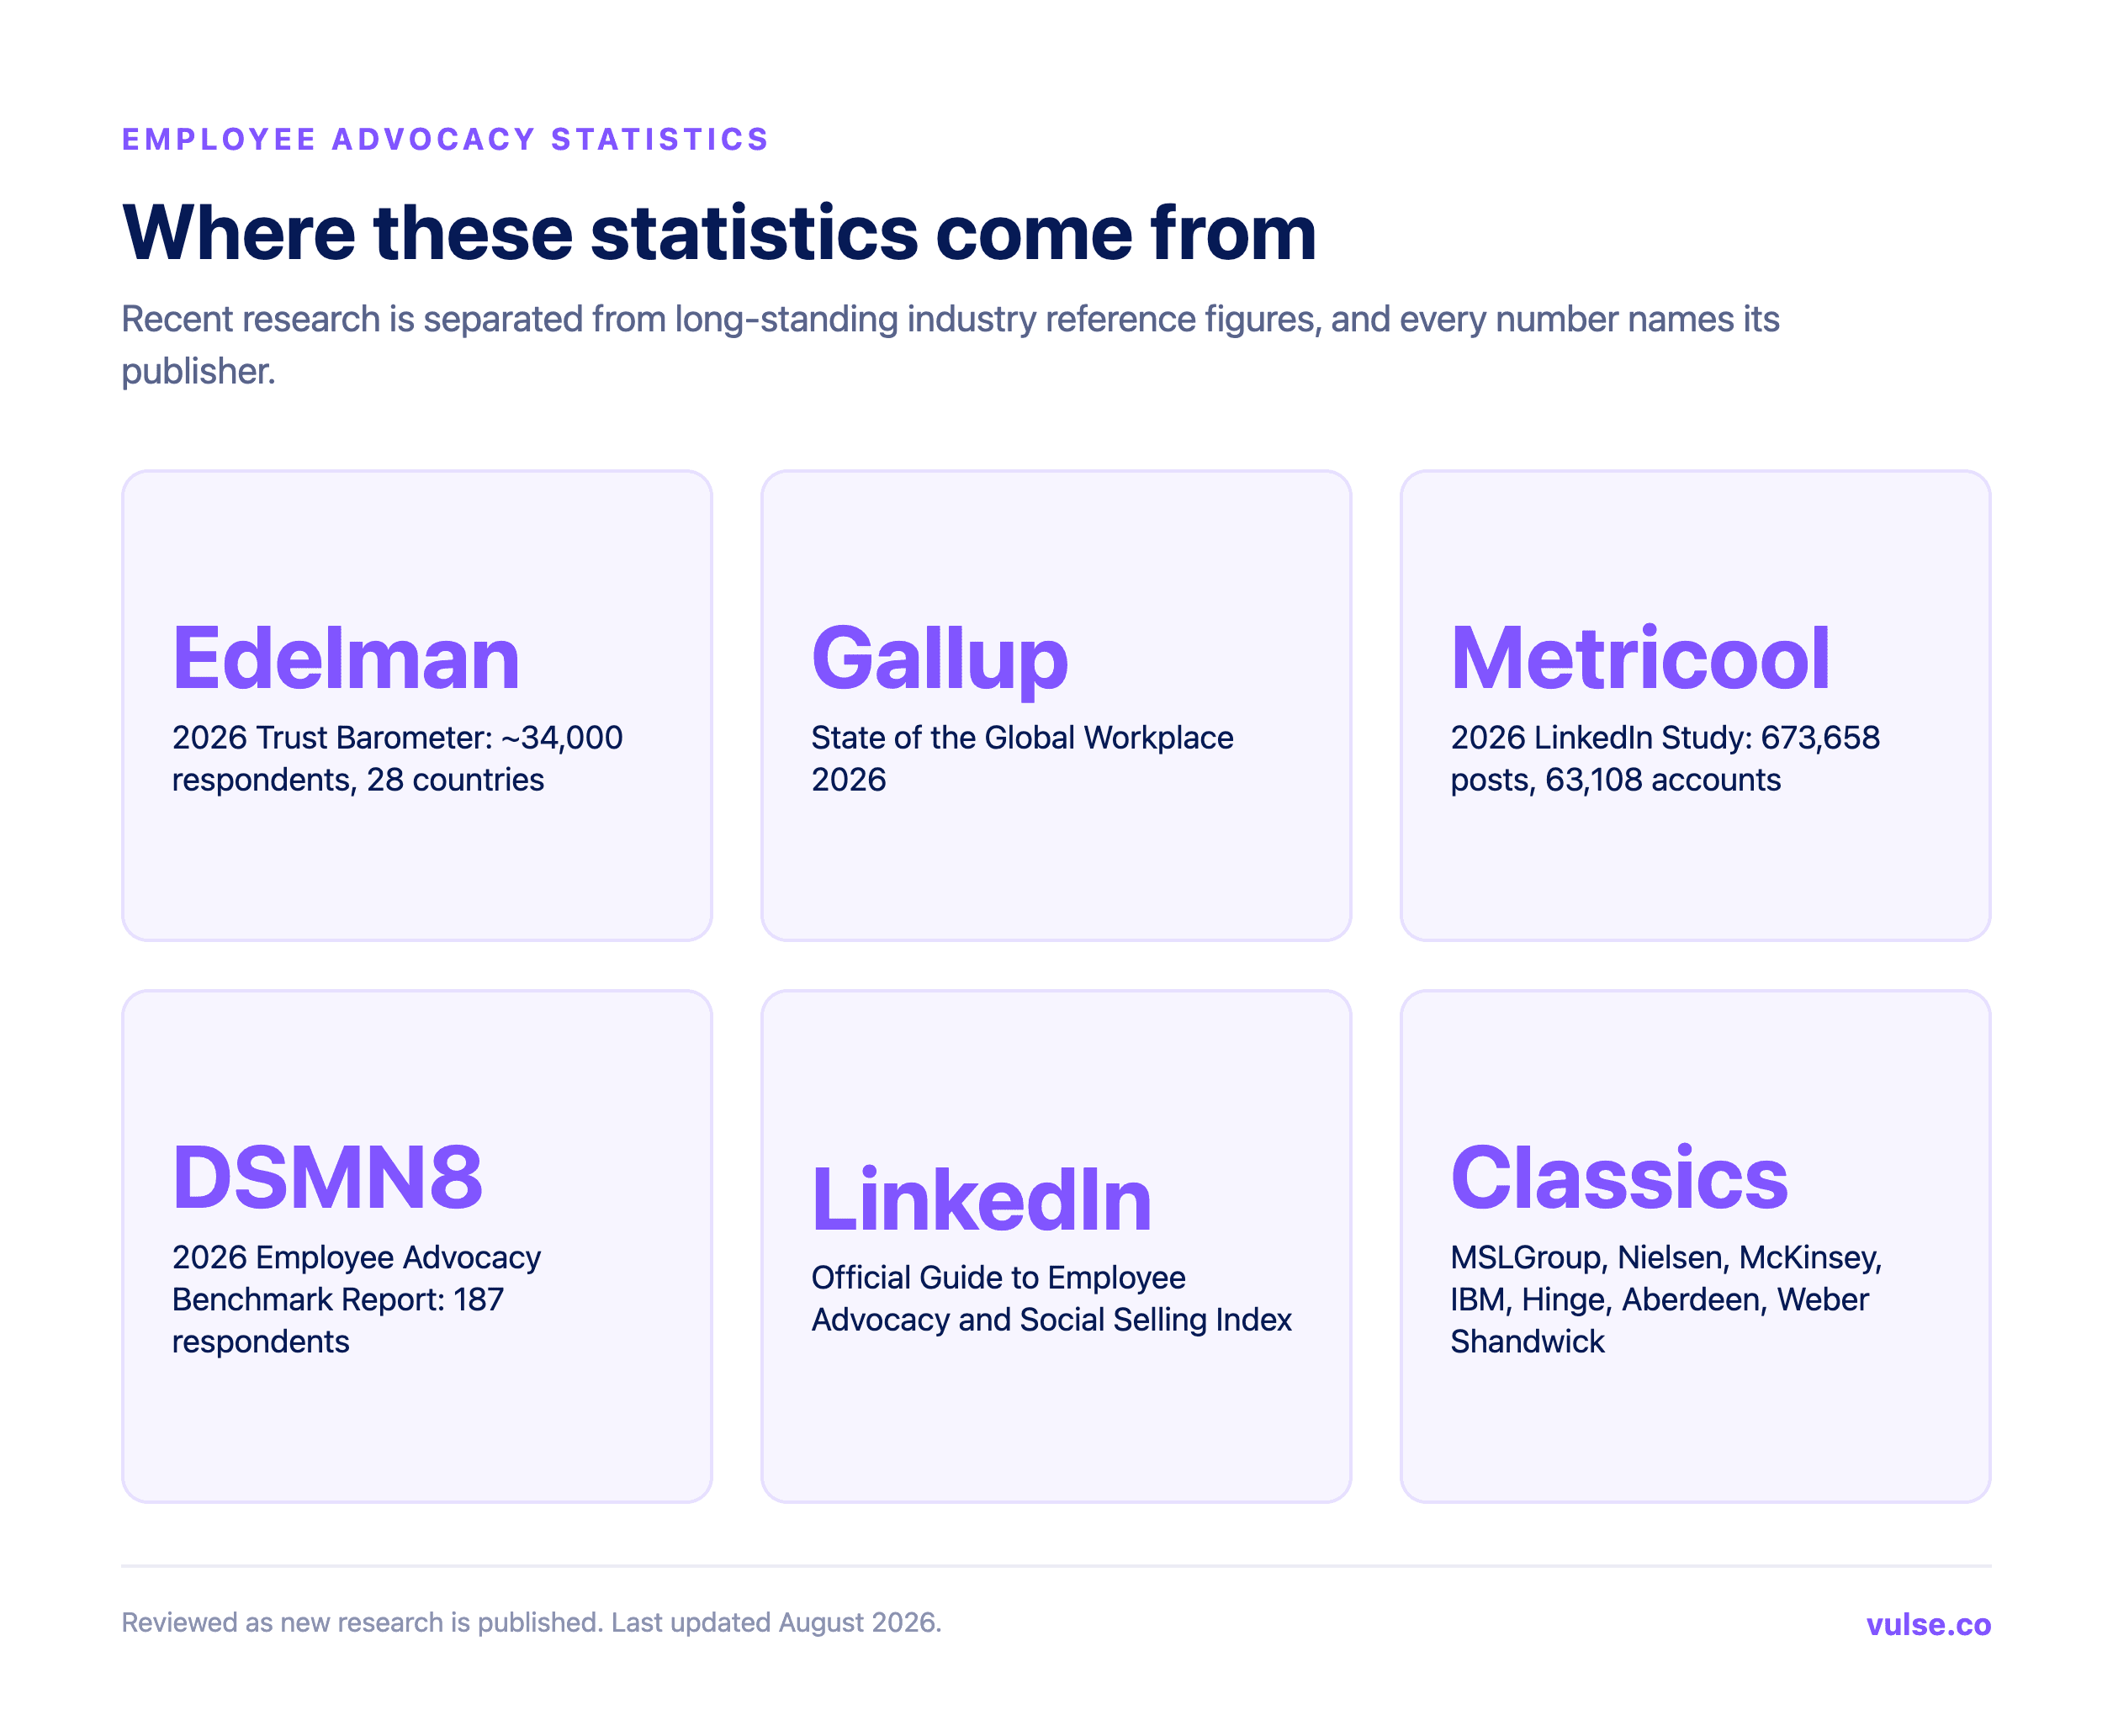
Before you paste any of this into a board deck, treat these figures as benchmarks that guide rather than guarantees. The long-standing reference figures here are credited to their original publishers, including MSLGroup, Nielsen, McKinsey, IBM, Aberdeen Group, Weber Shandwick, Hinge Research Institute and LinkedIn's Official Guide to Employee Advocacy. The newer numbers come from the 2026 Edelman Trust Barometer, Gallup's 2026 State of the Global Workplace, Metricool's 2026 LinkedIn Study, Sprout Social's 2026 research and DSMN8's 2026 Employee Advocacy Benchmark Report, with sample sizes noted throughout. Your results will move with participation, industry, network quality and content, so the only number that finally matters is your own. If you are building a business case, pair one reach or engagement figure with one participation benchmark and one cost-per-click comparison. Between them they answer the three questions leadership always asks: how far will this travel, will anyone actually take part, and what does it replace. We review this page as new research lands. It was last updated in August 2026.

30x more engaging
Peer recommendations generate around 30 times more engagement than traditional display advertising (McKinsey)

20-30% shorter cycles
Social selling trims the typical B2B sales cycle by a fifth to a third (LinkedIn)

68% already run one
Of marketing organisations already have an employee advocacy programme in place (Sprout Social Index)

26% of purchases
The average share of purchases influenced by social media recommendations across categories (McKinsey)

3x faster growth
Employees who share regularly grow their own networks around three times faster (LinkedIn)

6x more profile views
Active sharers attract around six times more views of their LinkedIn profile (LinkedIn)

75% back their leaders
Of programme managers say encouraging executive involvement is their top priority for 2026 (DSMN8)

45% of execs post
Of senior executives involved in advocacy programmes actively share content themselves (DSMN8, 2026)

Since using Vulse, I have posted 3x per week consistently, increasing my daily follower growth by 300%. My most engaging posts, generated over 4500 impressions.
Lara Hanson, Founder, Noux Talent
Employee advocacy statistics: frequently asked questions
The most quoted figure is that content shared by employees earns around 8x more engagement than the same content shared on brand-owned channels, from MSLGroup's social employee advocacy research. It is usually paired with the related finding that brand messages travel 561% further through employee networks than through official brand channels.
About 8x more engagement than the same content posted on brand-owned channels (MSLGroup), and roughly 2x the click-through rate (LinkedIn). On LinkedIn specifically, personal profiles generate around 63% higher engagement than company pages, based on Metricool's 2026 analysis of 673,658 posts from 63,108 accounts.
Around 561% further than the same message on brand-owned channels, and it is re-shared 24x more often (MSLGroup). The reason is network size: the average employee has around 10x more LinkedIn connections than their company has followers (LinkedIn).
Yes. Leads developed through employee social sharing convert about 7x more often than leads from other sources (IBM), 64% of advocates in formal programmes credited advocacy with attracting or developing new business (Hinge Research Institute), and social selling leaders create 45% more opportunities and are 51% more likely to hit quota (LinkedIn). In DSMN8's 2026 benchmark, sales teams accounted for 33% of all advocacy activity and reported a 64% improvement in win rate.
Participation is rising. In DSMN8's 2026 benchmark, 68% of advocates share three or more times a week and 21% post more than five times a week. LinkedIn's own research found that when only 3% of employees share company content, total engagement still rises by around 30%. Roughly 98% of employees use at least one social network personally and about half already post about their employer (Weber Shandwick).
Usually. In DSMN8's 2026 benchmark, 18% of programmes achieved a cost per click under $1 and 29.4% came in under $2, against typical LinkedIn paid benchmarks of $5 to $10 and broader B2B paid benchmarks of $2 to $6. Cost per click and earned media value are also the most common way programmes prove value, used by 67% of teams.
Companies with socially engaged employees are 58% more likely to attract top talent and 20% more likely to retain them (LinkedIn and Altimeter). Candidates weigh employee perspectives around 3x more heavily than the CEO's (Glassdoor), and 44.5% of people say they would be more likely to apply for a job if someone they knew shared it on social media (Aberdeen Group).
Because employers are the most trusted institution. The 2026 Edelman Trust Barometer, covering nearly 34,000 people across 28 countries, found 78% of employees trust their employer, 14 points ahead of business overall and 25 points ahead of government. People are also around 3x more likely to trust information about a company from an employee than from its CEO, and 88% trust recommendations from people they know above all other advertising (Nielsen).
About $523.7 million in 2025, forecast to reach roughly $1.18 billion by 2035 at a compound annual growth rate of around 8.5% (Future Market Insights). Estimates differ by methodology, with base-year figures ranging from $485 million to $928 million and CAGRs from 8.2% to 16.4% across research firms.
92% of programme managers use automated drafting tools to scale content production and a further 7% plan to adopt them (DSMN8, 2026). Governance is still catching up: 47% have clear tone-of-voice guidelines for automated content and 12% use a platform with tone-of-voice guardrails built in.
77% of teams track KPIs, most often earned media value or cost per click (67%), social following growth (43%), website traffic and conversions (43%) and engagement (36%), but only 44% benchmark against peers (DSMN8, 2026). A useful minimum set is participation rate, reach, engagement rate and cost per click compared with paid social.
This page combines long-standing industry reference figures published by MSLGroup, Nielsen, McKinsey, IBM, Aberdeen Group, Weber Shandwick, Hinge Research Institute and LinkedIn with recent research from the 2026 Edelman Trust Barometer, Gallup's 2026 State of the Global Workplace, Metricool's 2026 LinkedIn Study, Sprout Social and DSMN8's 2026 benchmark report. Every statistic names its publisher so the original can be checked. The page was last updated in August 2026.